-

AI Search & Retrieval
- Overview
-
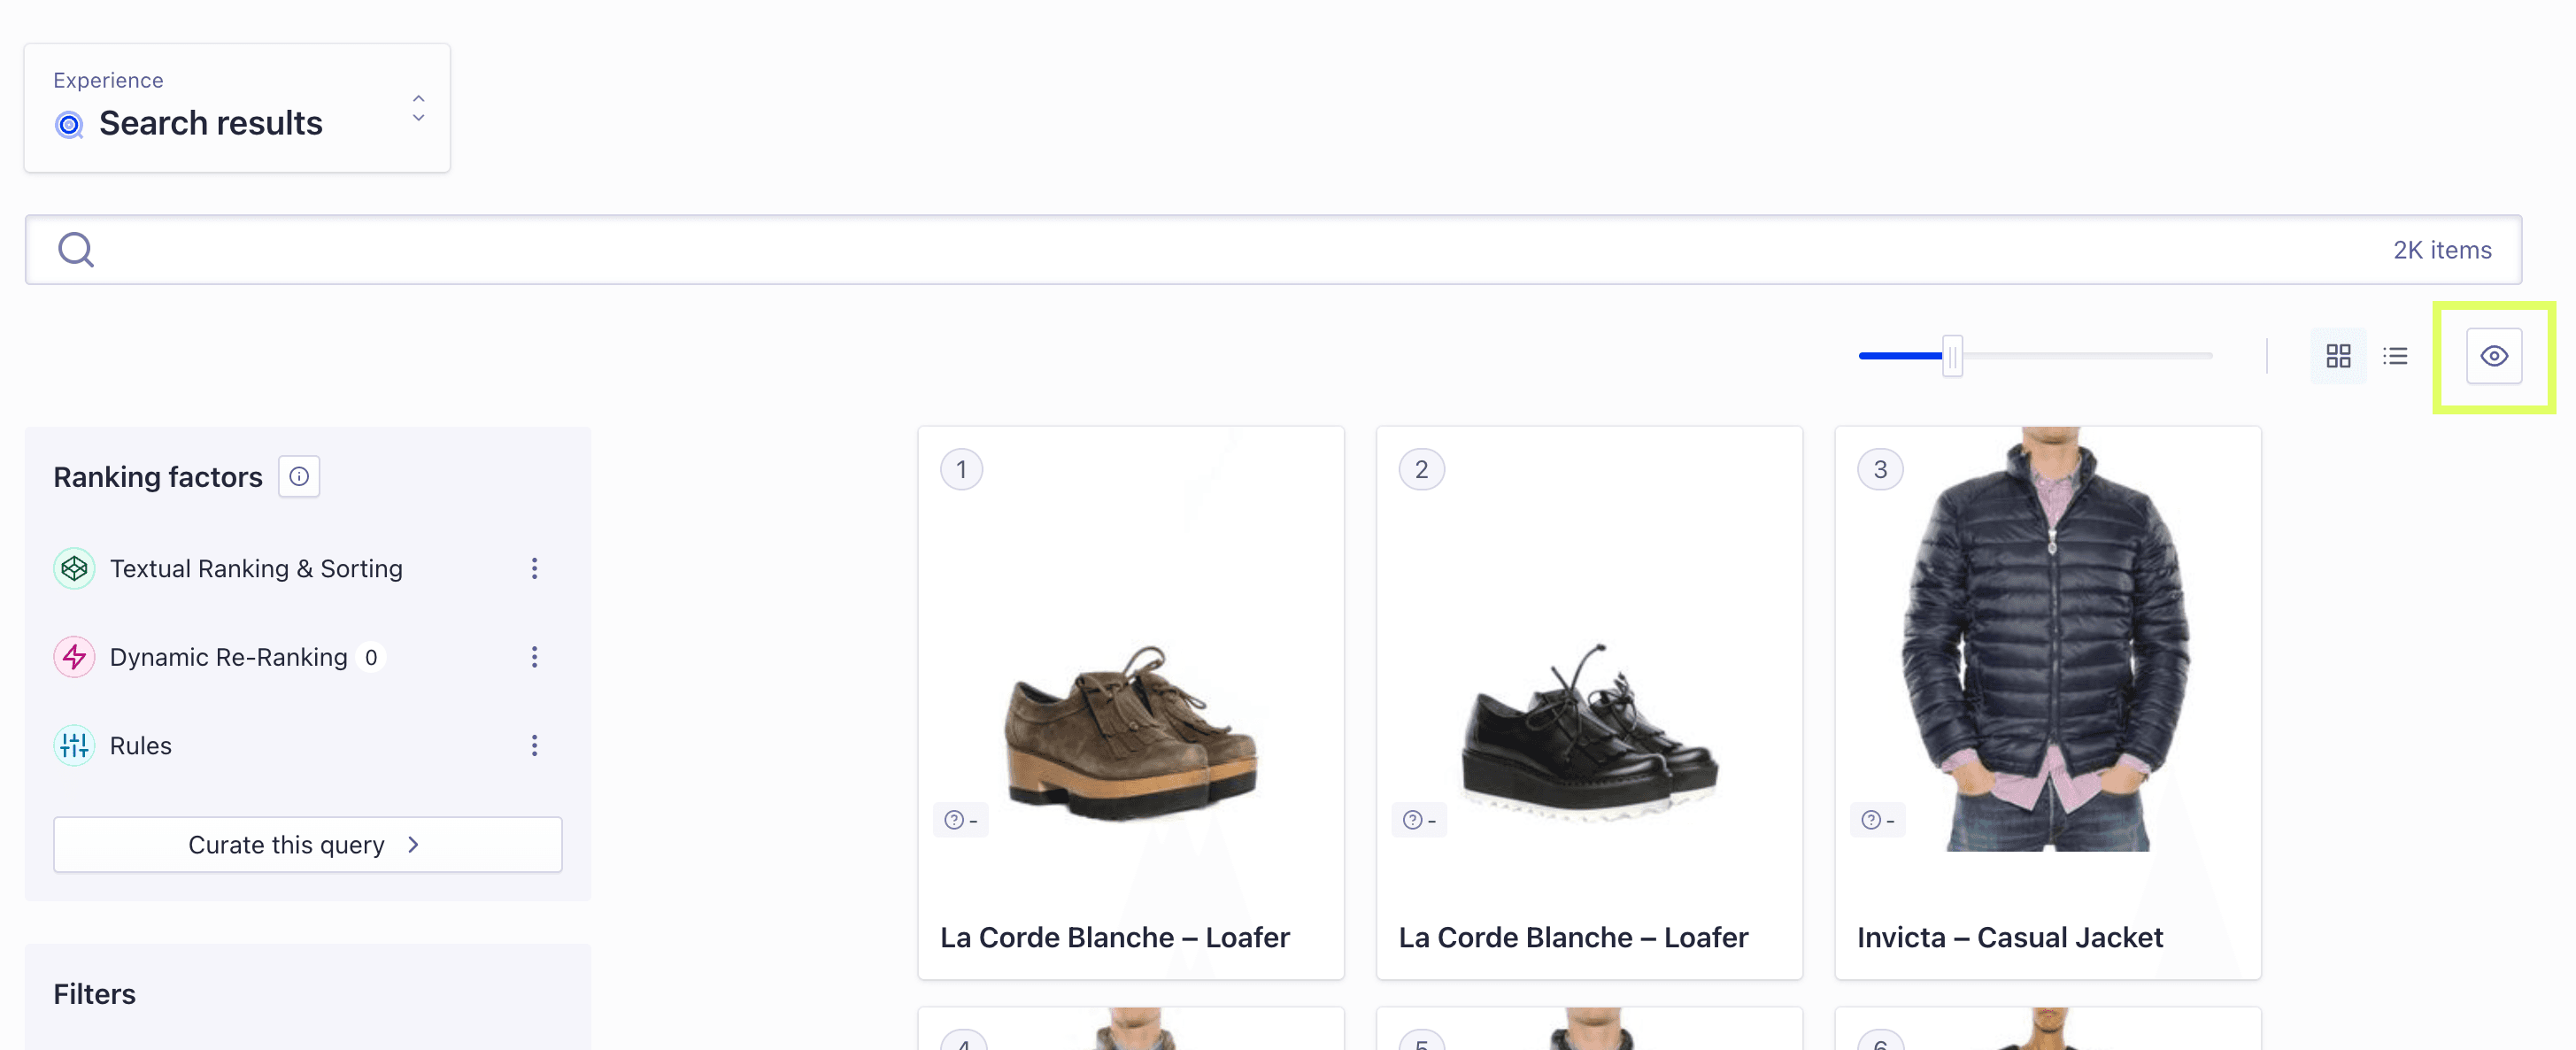
SearchShow users what they're looking for with AI-driven results.
-
RecommendationsUse behavioral cues to drive higher engagement.
-
PersonalizationShow each user what they need across their journey.
-
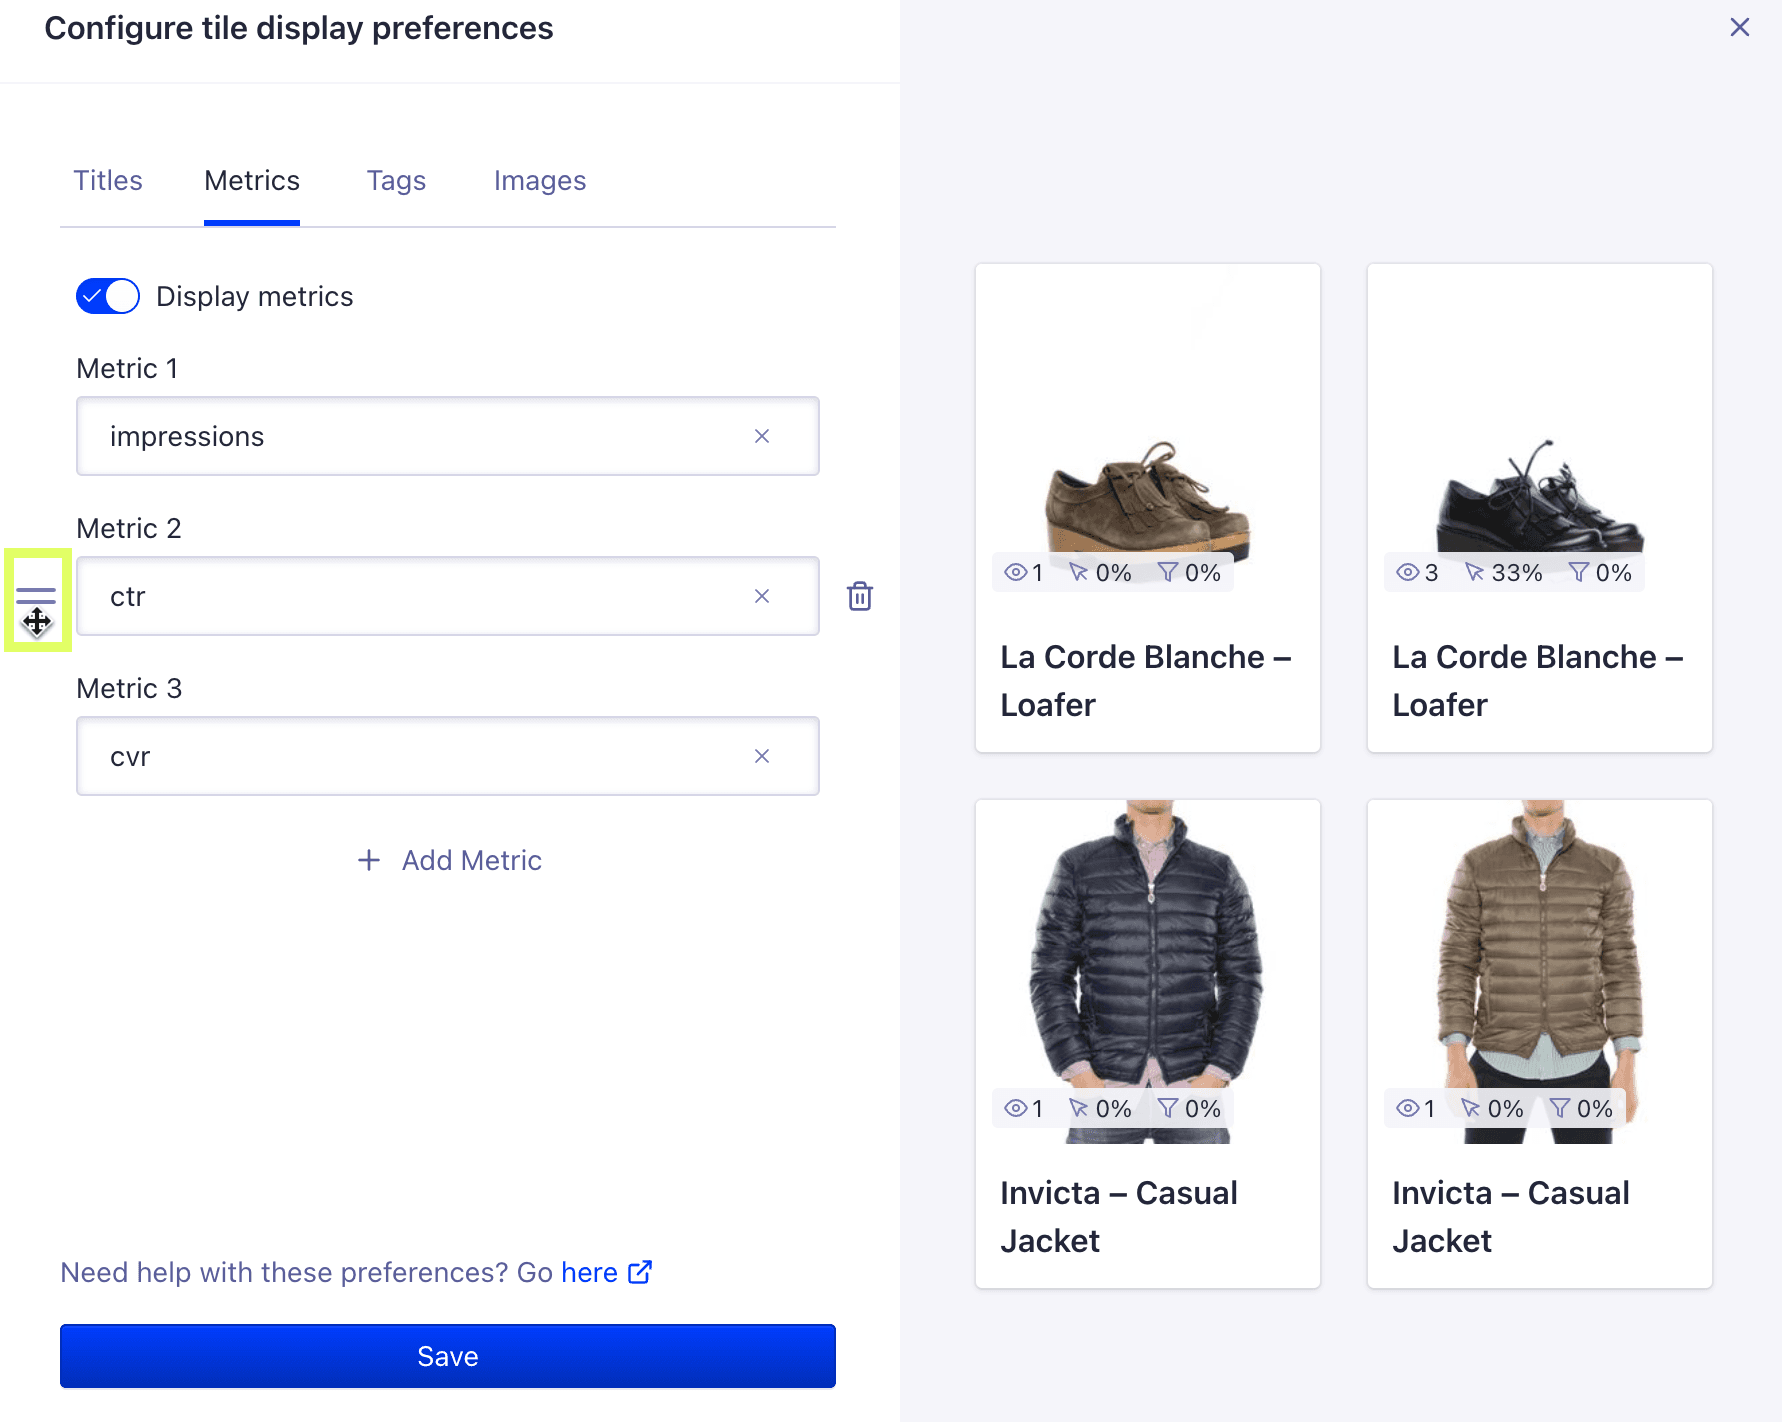
AnalyticsAll your insights in one dashboard.
-
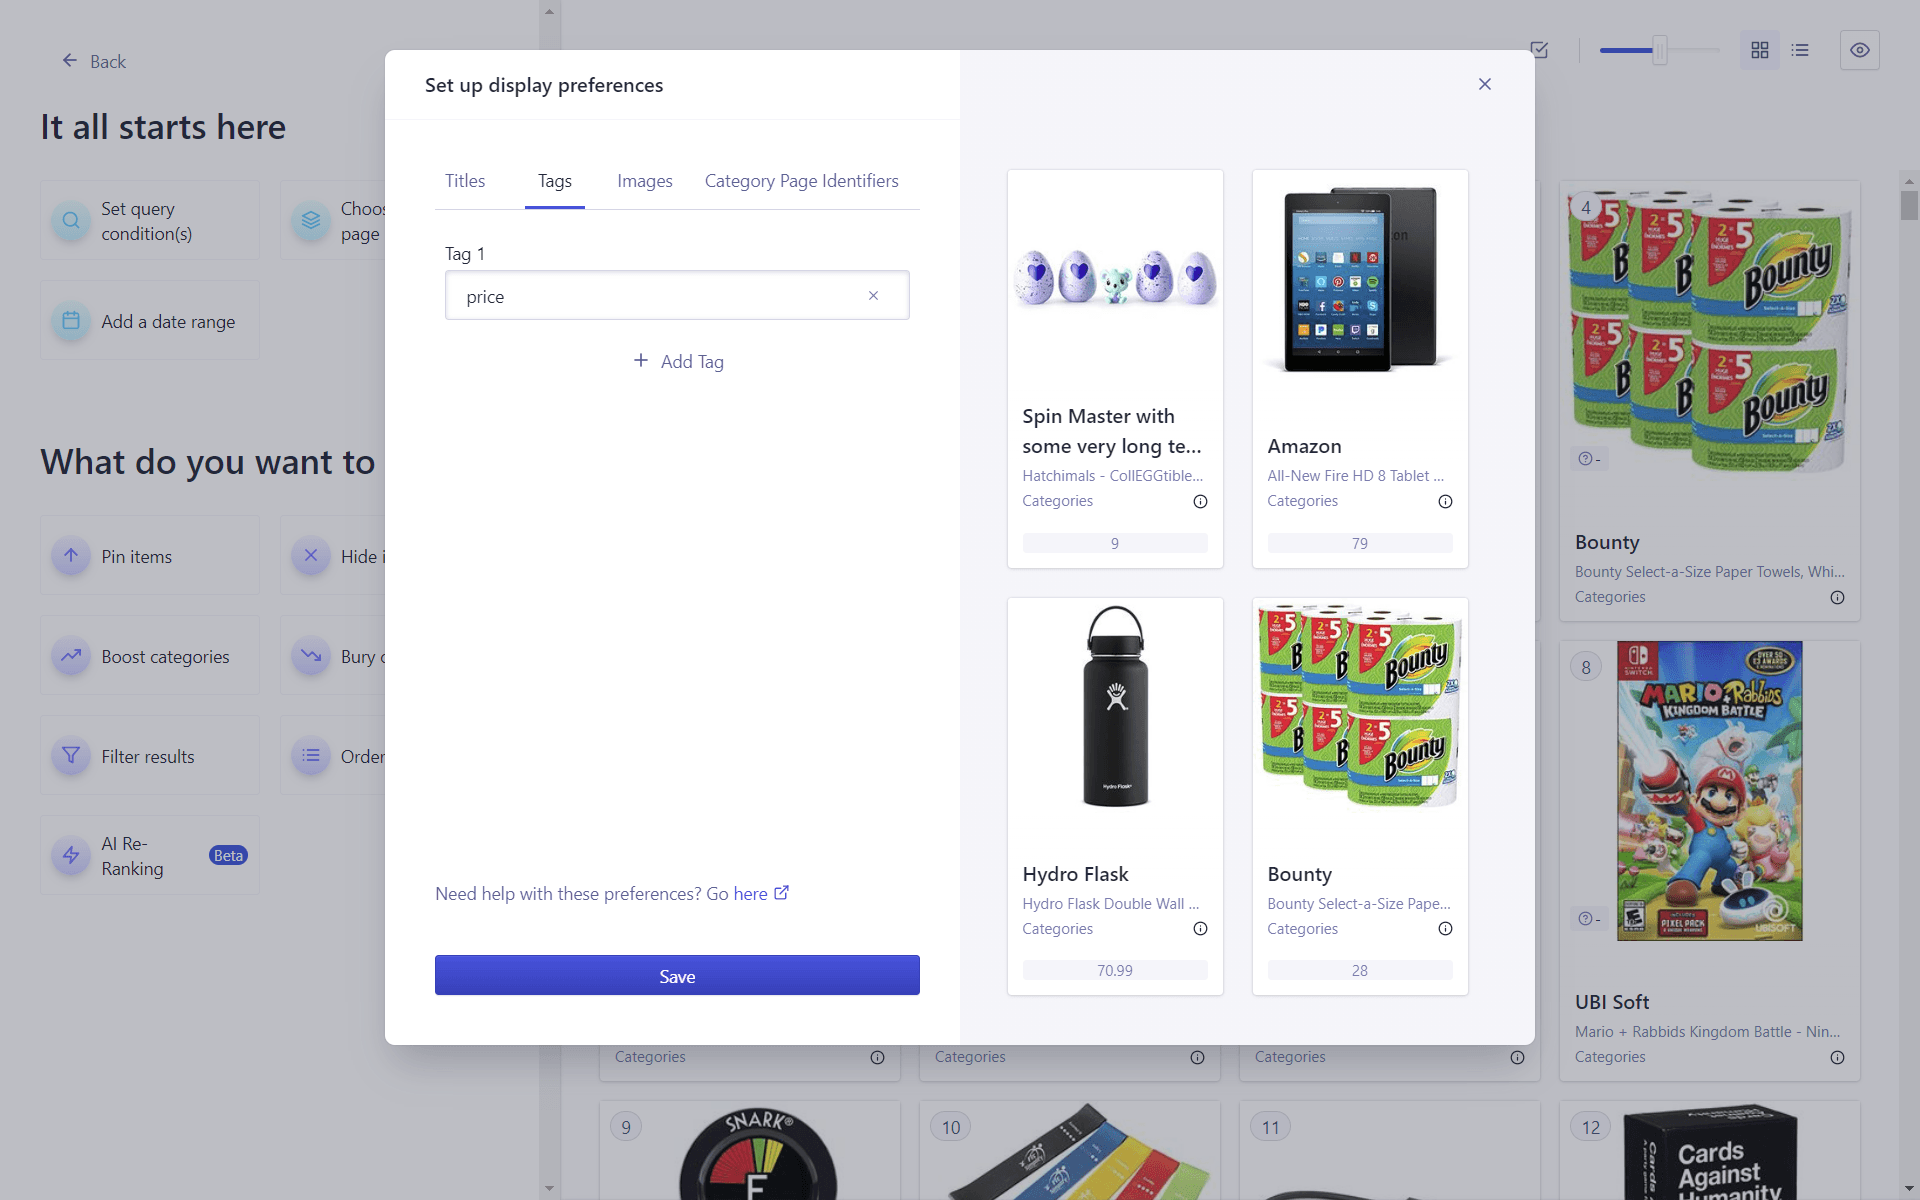
BrowseMove customers down the funnel with curated category pages.

Artificial Intelligence
- OVERVIEW
-
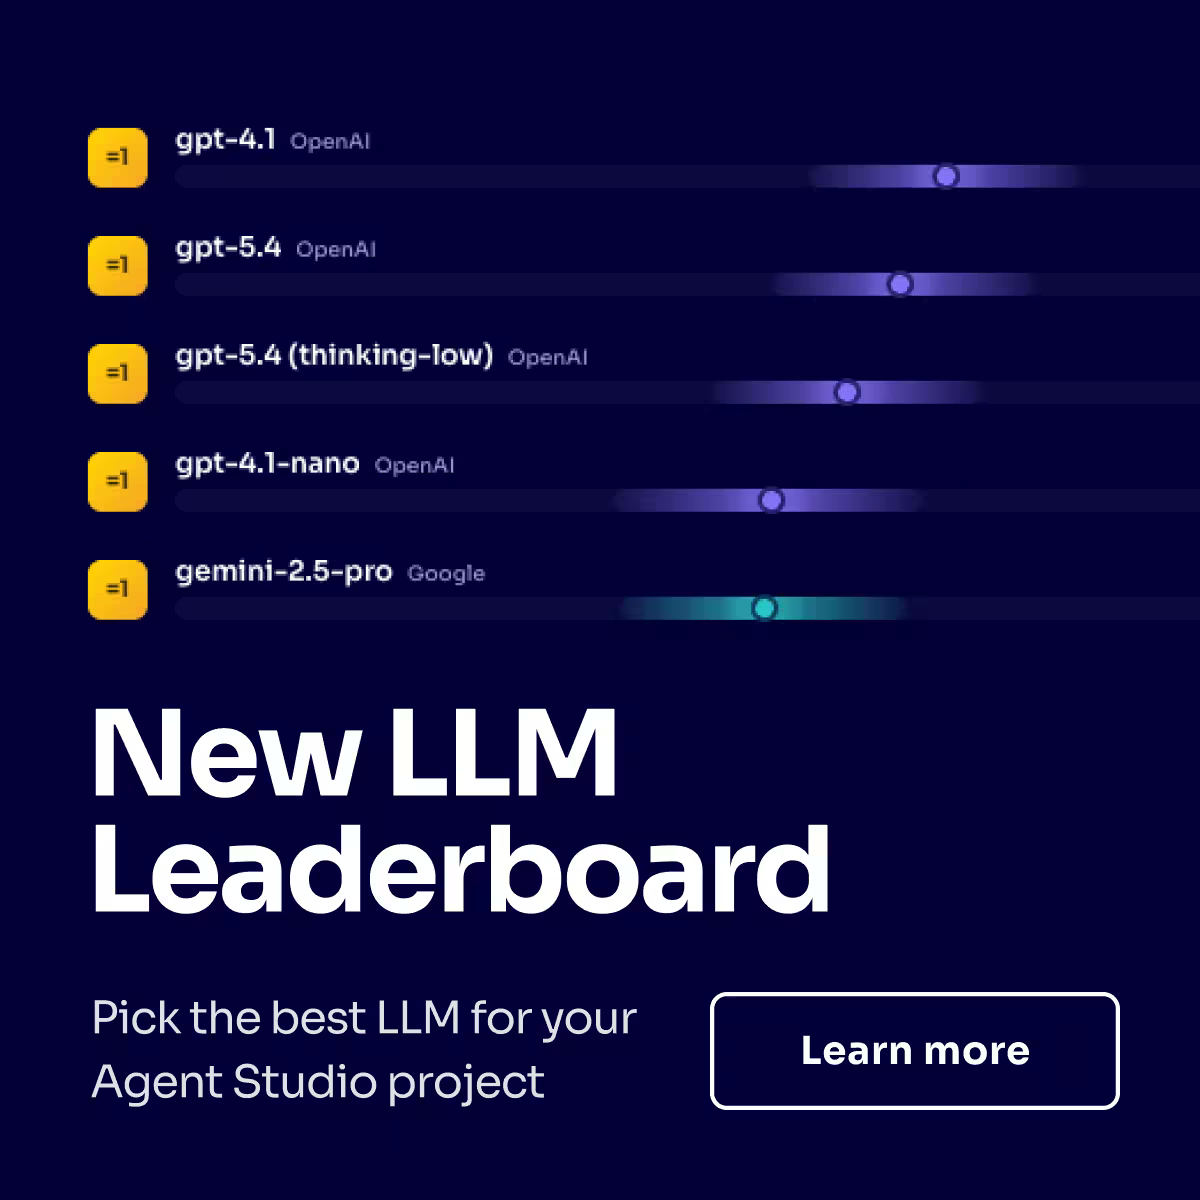
Agent StudioCreate, test, and deploy AI agents, fast.
-
Generative ExperiencesBuild conversational solutions with retrieval augmented generation (RAG).
-
Ask AIDeliver conversational answers—right from your search bar.
-
MCP ServerSearch, analyze, or monitor your index within your agentic workflow.

Intelligent Data Kit
- Overview
-
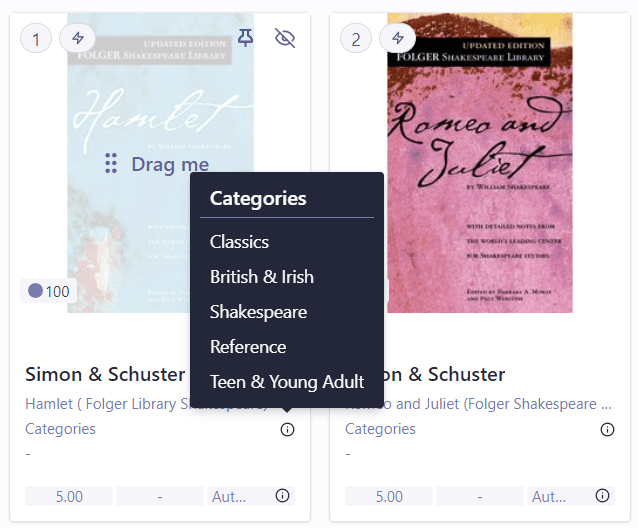
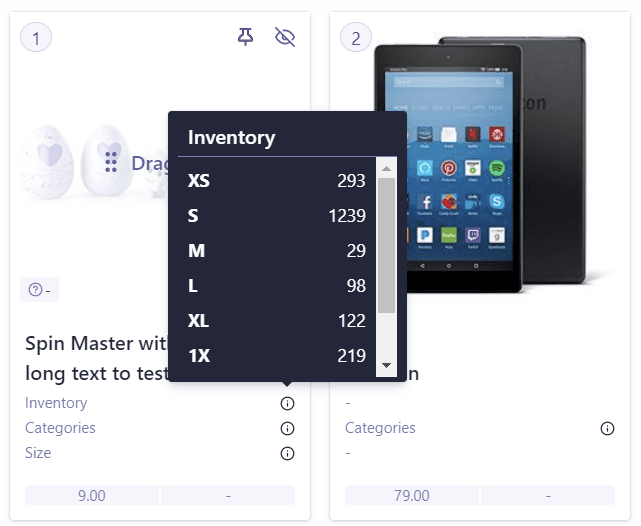
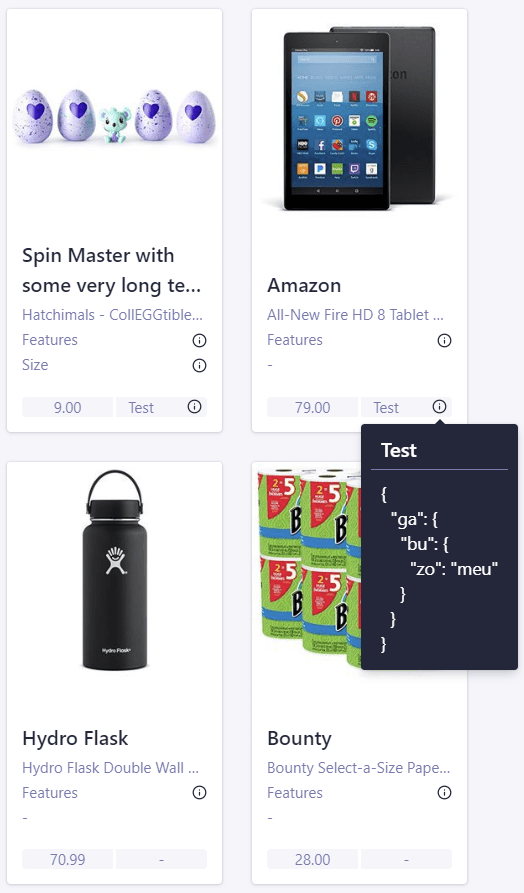
Data EnrichmentModify, enhance, or restructure data as it’s indexed for search.
-
Data TransformationStreamline data preparation and enhance data quality.
-
IntegrationsConnect to your existing stack via pre-built libraries and APIs.

Infrastructure
- Overview
-
Data CentersChoose from 70+ data centers across 17 regions.
-
Security & ComplianceBuilt for peace of mind.
-

Industries

Use Cases
- Pricing
-

Get started

Resources
-

Discover

Customers
Filter
Looking for our logo?