A/B testing is one of the most critical tools in any data-driven developer’s toolkit. But if you’ve ever wrestled with the intricacies of determining an appropriate sample size—balancing confidence levels, power, minimum detectable effect (MDE), and variant splits—this article plus an all new feature built into the Algolia dashboard can help.
Why does sample size estimation matter?
Accurate sample size estimation ensures your test is:
-
Statistically valid – Minimizing false positives (Type I error) and false negatives (Type II error).
-
Efficient – You won’t waste resources over-testing or under-testing.
-
Actionable – You’ll have sufficient evidence to confidently decide which variant is superior (or if they’re effectively the same).
Our new A/B Testing Estimator helps you quickly determine how many visitors or events you need in each variant to have a statistically meaningful result.
Overview of the new feature
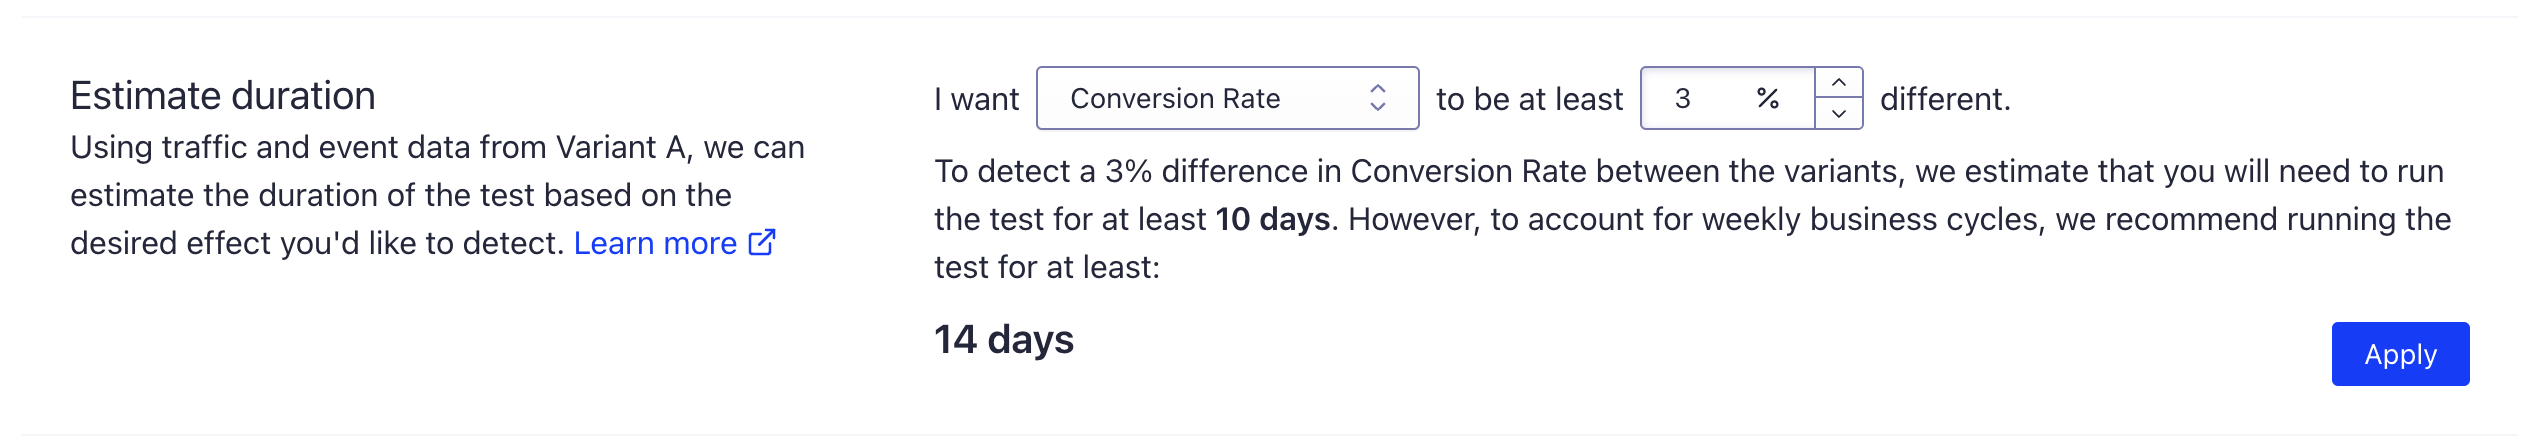
In our dashboard UI, you’ll see an option that looks like:
Under the hood, this translates into:
-
Historical Baseline – We look up your existing baseline rate for the chosen metric (e.g., conversion rate) in your application’s historical data.
-
Minimum Detectable Effect (MDE) – This is the smallest effect size (in relative terms by default) that you wish to detect. In our API, you pass something like 0.03 for a 3% relative difference. For example a 3% relative difference on a 5% baseline conversion rate would be between 4.85% and 5.15%.
-
Statistical Parameters – By default, behind the scenes we use:
-
Traffic Split – You can choose an uneven traffic split across your variants, which may require larger total sample sizes than a simple 50/50 split.
Once these inputs are specified, the estimator returns the required sample size for each variant (including the control) as well as the total sum. In the dashboard we simply convert this to the estimated duration the test will need to run for, based on your average daily historical traffic rates.
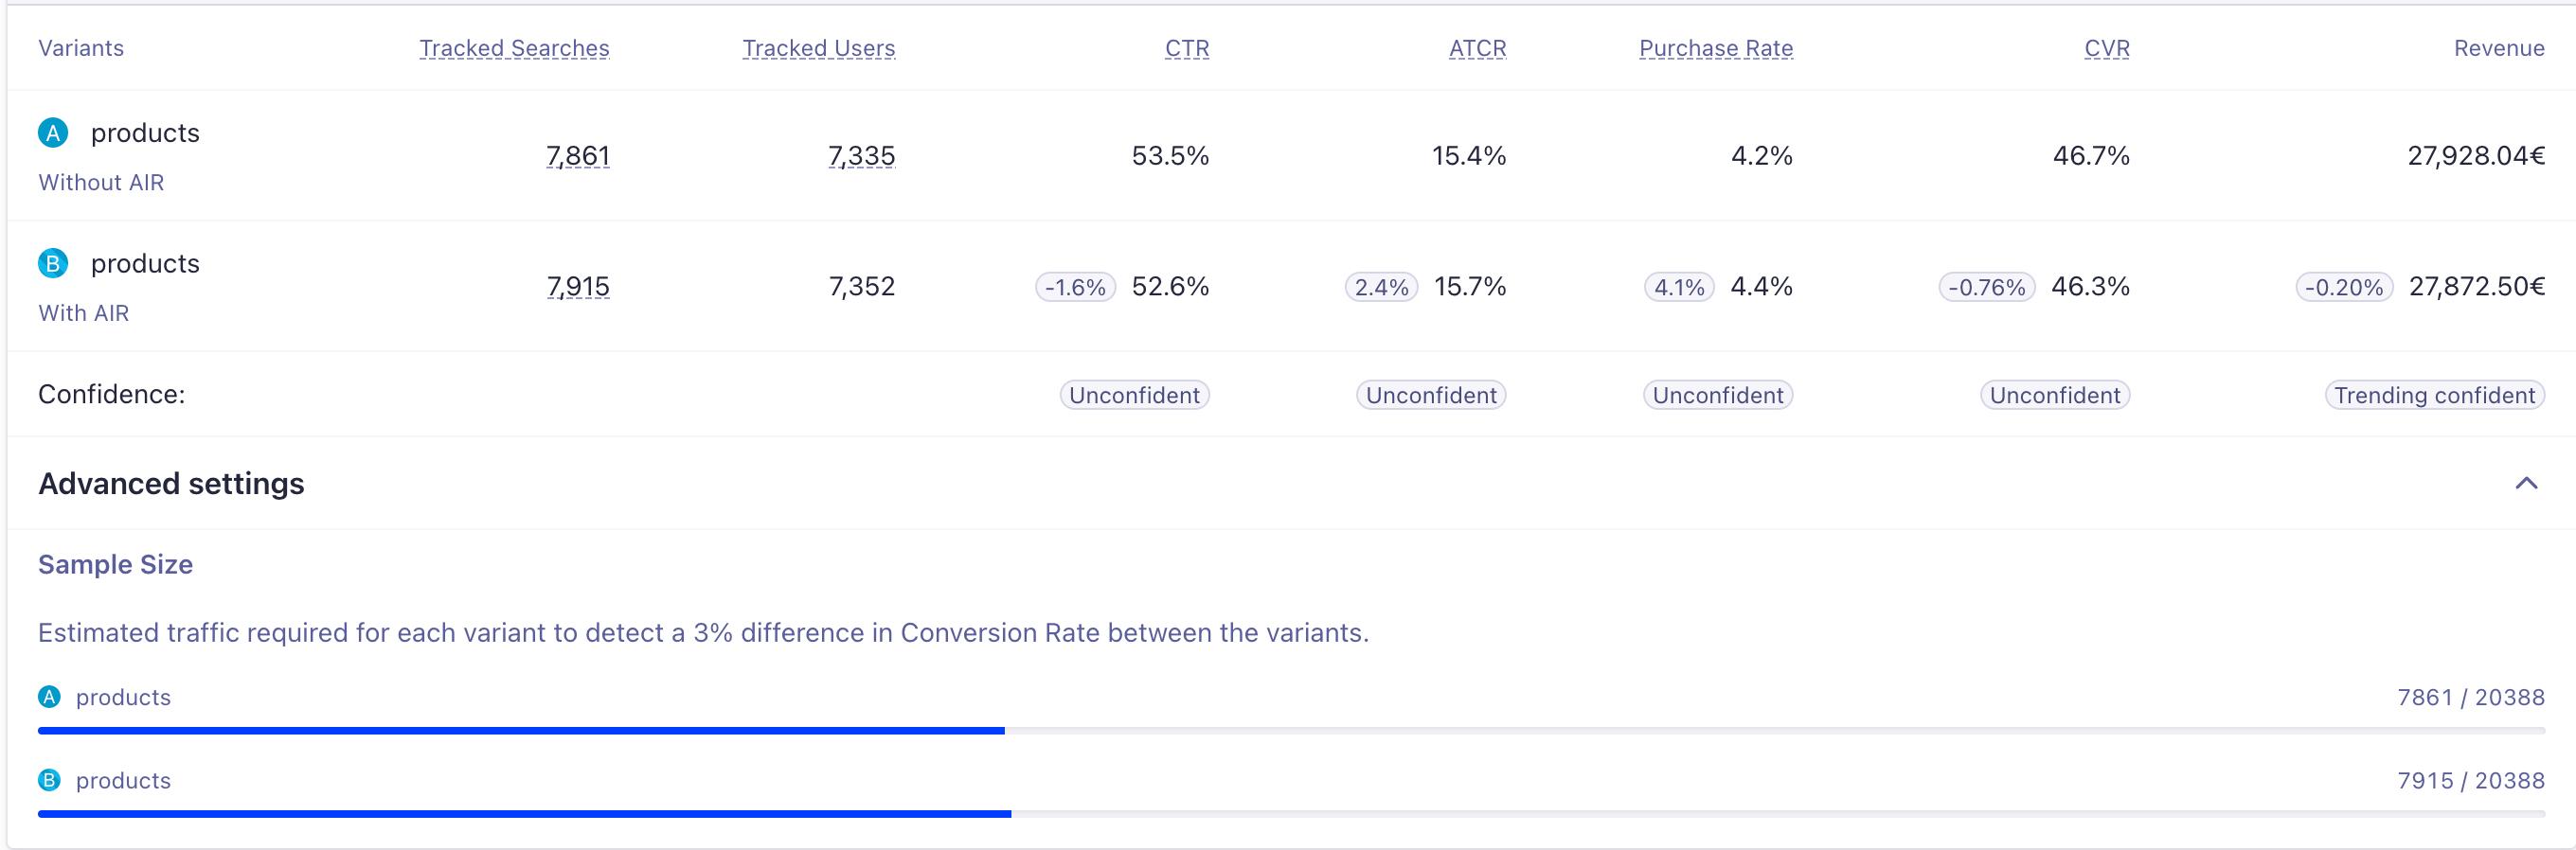
You can see the measured progress towards your estimation (in samples) under the ‘Advanced Settings' section of your test.
The statistical formula behind the scenes
Under the hood, we use a variation of the classic formula for sample size estimation in two-proportion z-tests. The simplified two-variant formula can be expressed like this:
\begin{aligned}
n_1 &= \kappa \, n_2 \\[6pt]
n_2 &= \frac{(z_{\alpha/2} + z_{\beta})^2}{\epsilon^2} \left[ \frac{p_{1}(1-p_{1})}{\kappa} + p_{2}(1-p_{2}) \right] \\
\end{aligned}
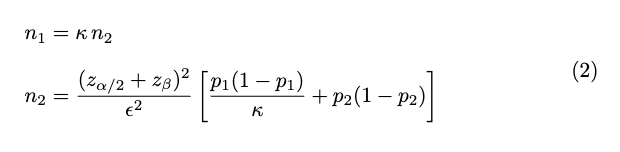
Where:
-
p1 is the control’s baseline rate.
-
p2 is the baseline rate adjusted for the MDE.
-
ϵ is the MDE (the difference you want to detect).
-
κ is the split ratio.
-
zα/2 is the z-score threshold for a significance level.
-
zβ is the z-score threshold for the desired power ( β=1−power ).
We use a slightly modified version of this two-variant, to allow for multi-variant tests, where the estimated controls sample size ends up being the largest n difference between all samples, and each variant’s sample size is just a ratio of the control.
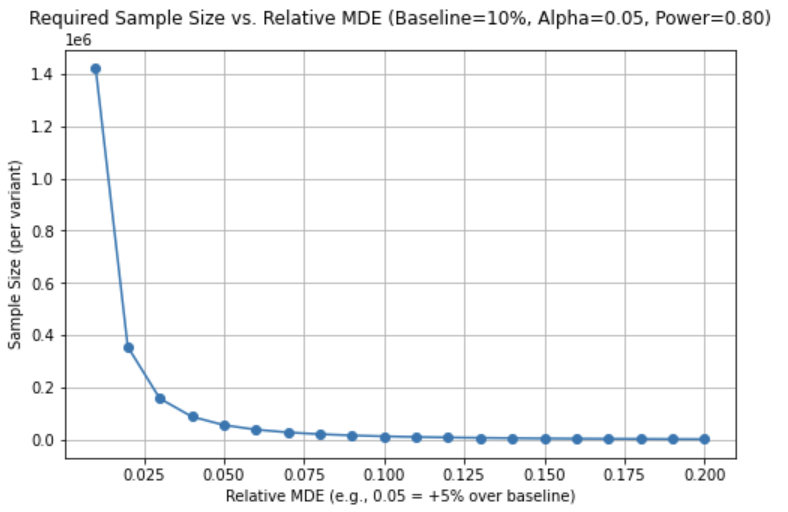
Visualizing MDE and sample size
One of the most helpful ways to reason about sample size is to visualize how an increasing MDE (the difference you want to detect) decreases the required sample size. Conversely, demanding a tiny MDE means you need a larger sample size to detect that difference reliably.
.png)
Similarly, an uneven traffic split (e.g., 70% to the control, 10% each to three variants) will generally demand higher total samples than a 50/50 or evenly distributed test—because each variant receives fewer exposures, requiring more total traffic to achieve the same power.
Minimum Detectable Effect is not a guarantee that you’ll reach statistical significance after the given amount of time. The sample sizes that are calculated are just estimates of the number of samples you would need if the change actually exists. After the duration elapses, you need to analyze the observed results, versus the effect you wanted the change to have, in order to determine whether you should adopt the change.
For example, if you wanted a relative MDE of 5%, but the observed change is 3% and inconclusive, then it likely means that there weren’t enough samples, and that the change you were testing just isn’t having the desired effect.
Example use cases
Here are two quick scenarios to illustrate how the estimator might be used:
Example 1:
Input:
-
Conversion Rate: 5%
-
MDE: 5% (relative)
-
Split Ratio: 50/50
-
Variants: 2
Output:
This illustrates a pretty canonical case, in a two-sample test. Depending on the number of samples received per day, it could take a variable amount of time to achieve confidence in detecting a 5% change.
For instance, if the control index receives 1000 searches per day on average, then it’d take ~244 days to detect at least a 5% change with confidence. If, on the other hand, the app receives 10,000 searches, it’d take only 24 days to reach confidence in a 5% change.
Example 2:
This is the exact same example, but we want to be confident that we can detect a 2% change, rather than 5%, with confidence before drawing conclusions.
Input:
-
Conversion Rate: 5%
-
MDE: 2% (relative)
-
Split Ratio: 50/50
-
Variants: 2
Output:
This illustrates the difference in confidently detecting a smaller change; we need a larger sample size!
How to get started
A/B testing is a core feature used by thousands of clients to improve user experience while also delivering higher revenue and lower support costs. If you haven't already gotten started with A/B testing, check out our docs or see hands-on training in Algolia Academy.
For estimating duration and sample sizes, look for the “Estimate Duration” section in the A/B test configuration. Just input your metric of interest and the desired change to leverage the historical analysis of the tool.
You can also directly request these estimations via the API! See the API specification, or use one of the Algolia API clients to start getting more accurate testing scenarios.


%20(2).svg)