In this post, I want to share how our analytics and A/B testing team used a semantic analytics package to turn a bottleneck into a platform — and what that unlocked for both internal teams and customers. This was a topic I had originally presented at DevBit, a semi-annual virtual event (next one coming up in April), and you can watch that recording below.
The problem: analytics was becoming a scaling issue

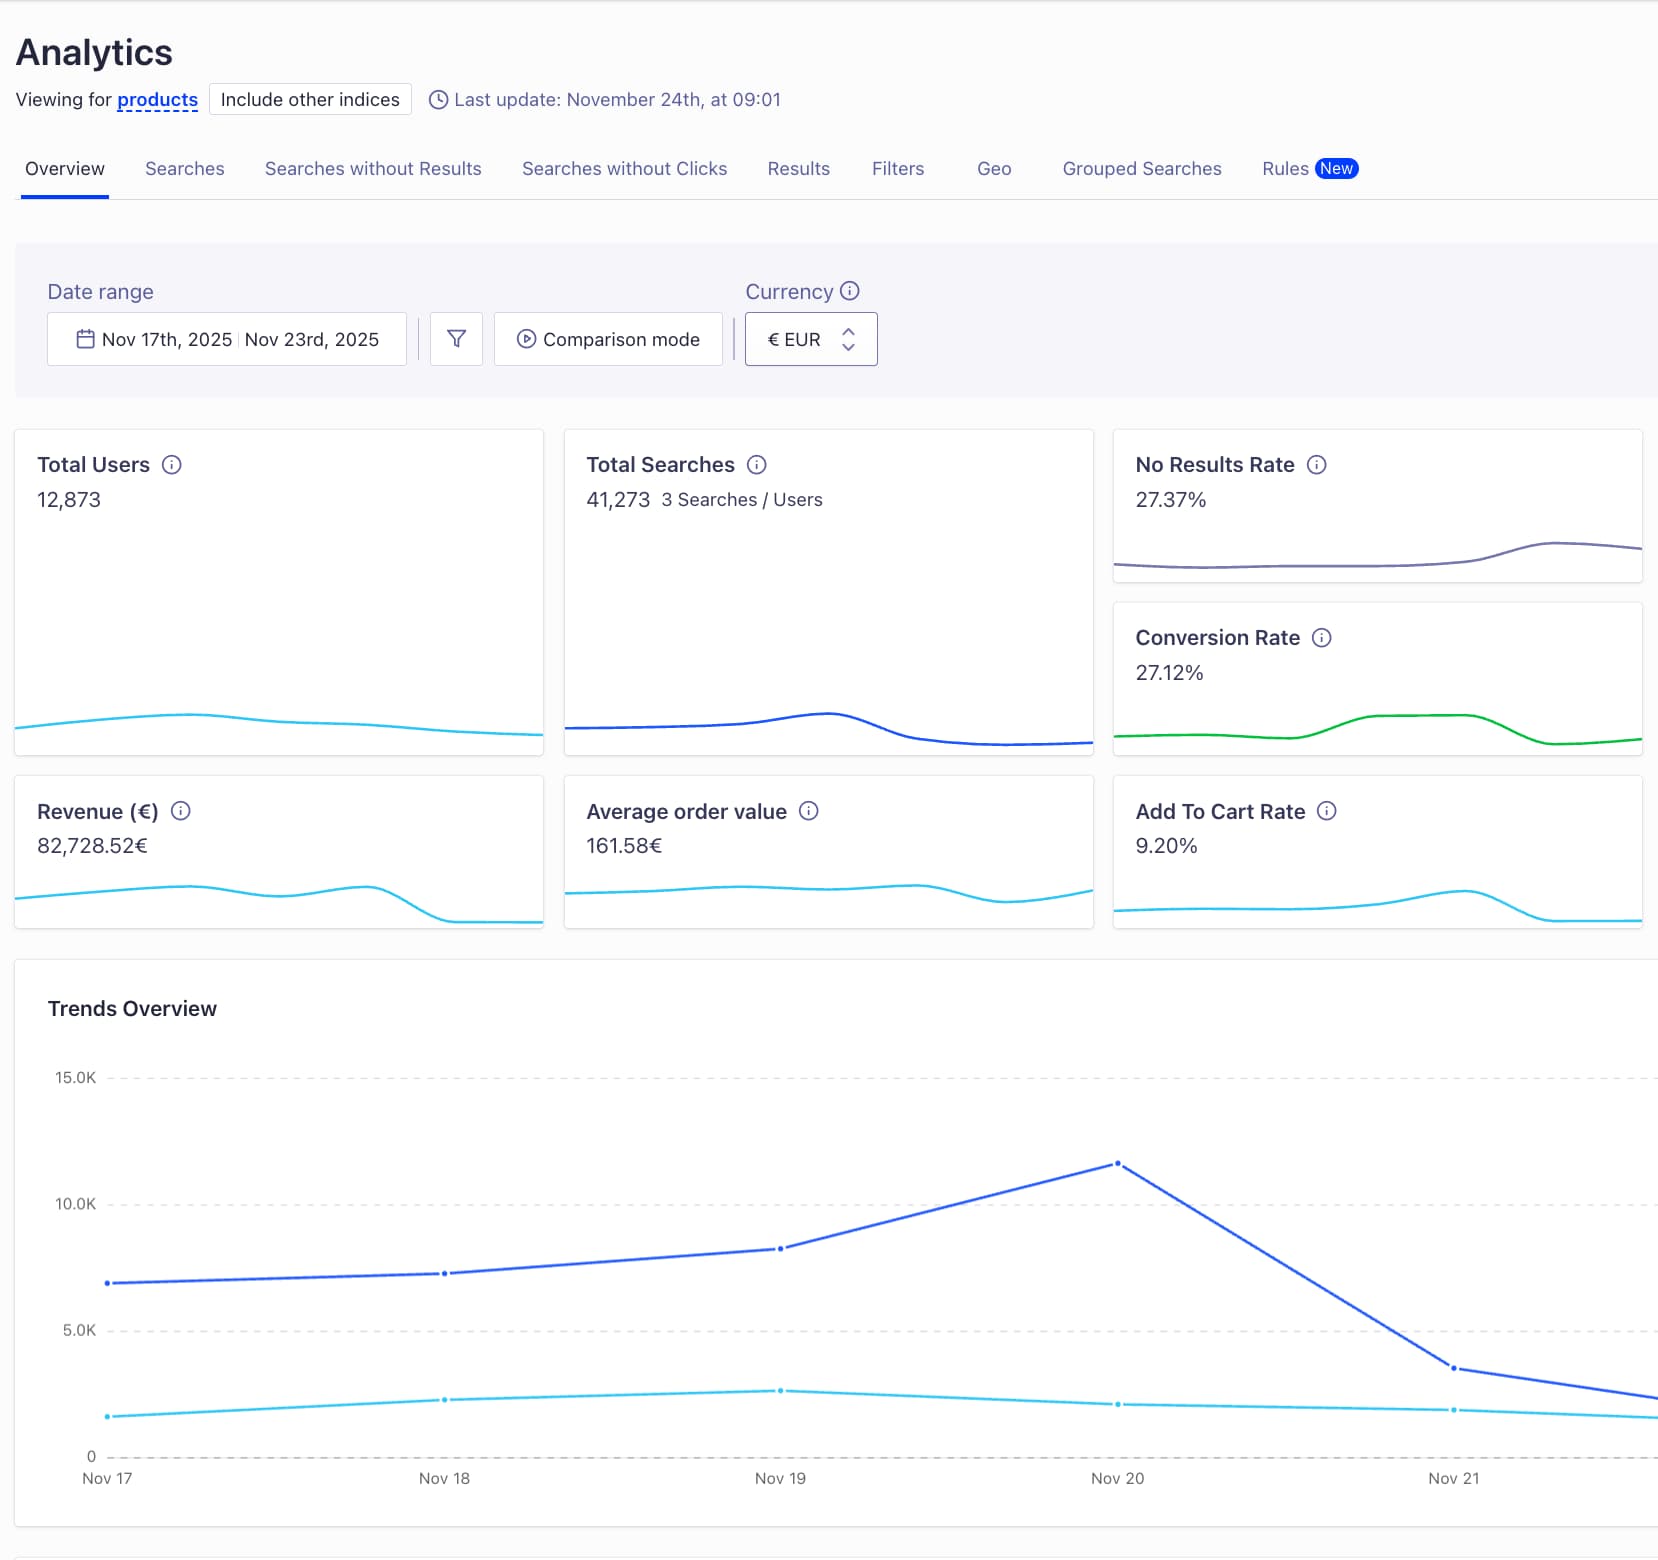
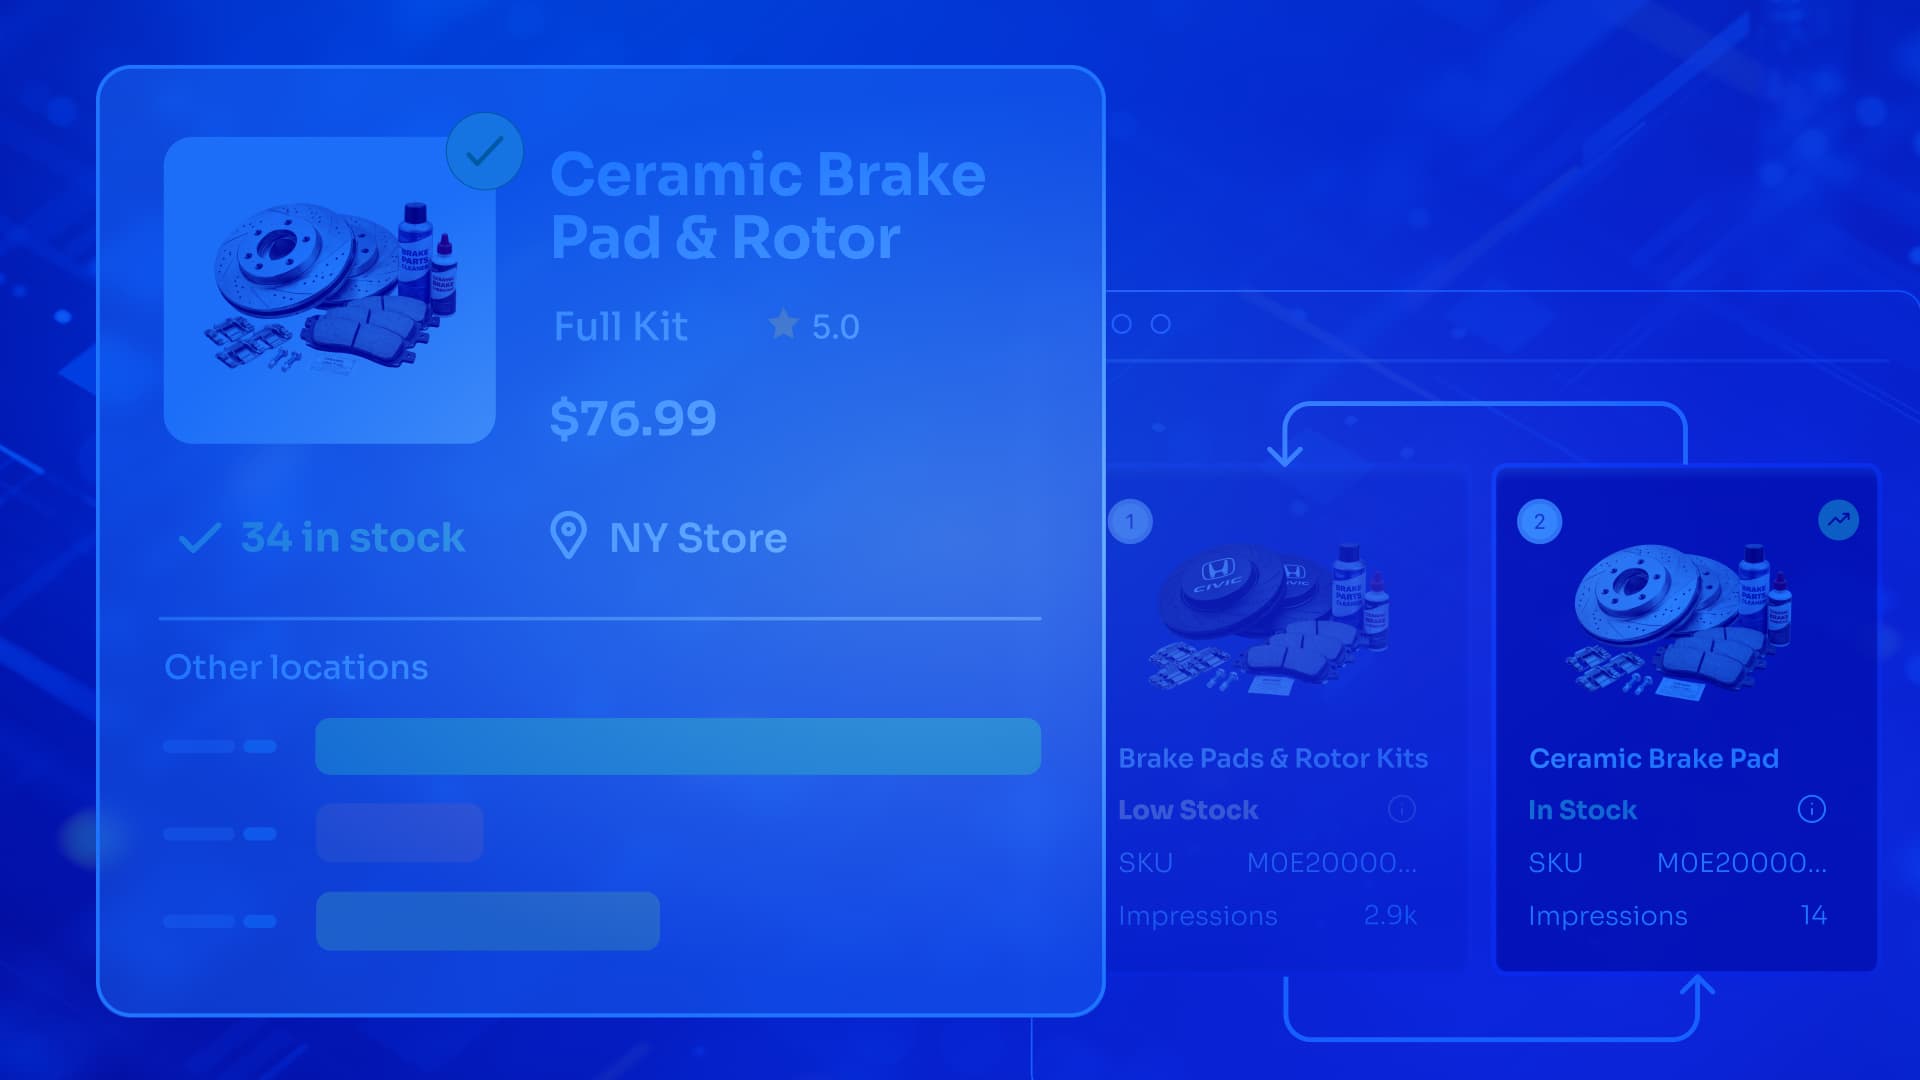
Screenshot of the analytics dashboard in Algolia
Our customers want clear performance KPIs on how search has impacted their business. Most customers interact with Algolia search through the main analytics overview page in the dashboard. That’s where we show search performance metrics like users, clicks, conversions, and trends over time. You’ll also see things like top searches, searches without clicks, and searches with no results — all designed to help you diagnose and improve search performance.
But, we don’t just build one analytics experience. We also power analytics for individual Algolia features.
- Visual Merchandising Studio has its own breakdowns
- Rules analytics has its own set of metrics and edge cases
- And, we keep shipping new features, which means our analytics surface area must expand along with it

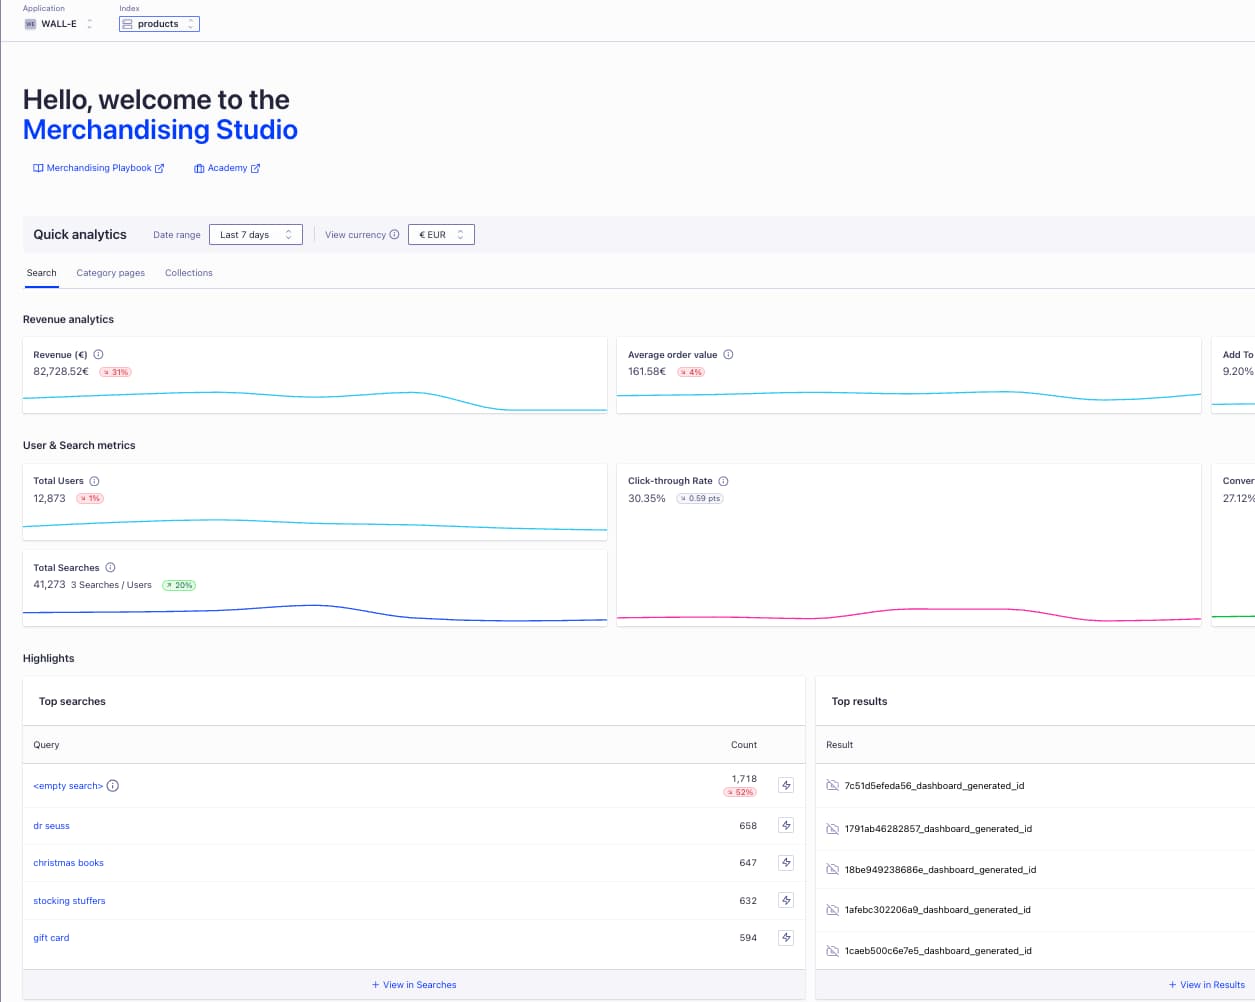
Algolia also powers feature analytics pages like this one for the Merchandising Studio
Over time, we hit a scaling wall. We were managing a growing set of analytics data products, and we needed to keep up with the pace of development across the company.
A big part of the challenge was that we had to support the same underlying concepts at different levels of aggregation. For instance, you might look at “searches without clicks” across an entire index over a time period, and at the same time you might show daily metrics like click-through rate and no-click rate.
Those two metrics sound similar, and they share a lot of the same ingredients, but our old implementation treated them like separate tracks. We calculated click-through rate in one path and no-click rate in another path. That kept things accurate, but it wasn’t scalable. It was repetitive, it was slower than it needed to be, and it increased the chance of errors because we were effectively re-implementing the same logic in multiple places.
On top of that, our API design wasn’t well suited for analytics as a data product. We had coupled specific endpoints to specific metrics. That’s a very normal API pattern, but for analytics it became rigid. Every time we wanted to add a new metric, we had to add a new endpoint. Over time, endpoint names also started to look similar enough that it wasn’t always obvious what you were calling.
When you put all of that together, we could summarize the flaws of the old system pretty simply: it wasn’t flexible, it created a lot of manual work for engineers, and it was turning our team into a development bottleneck.
The approach: put a semantic package in front of search data
What we wanted was a much more flexible way to write SQL queries and use them dynamically.
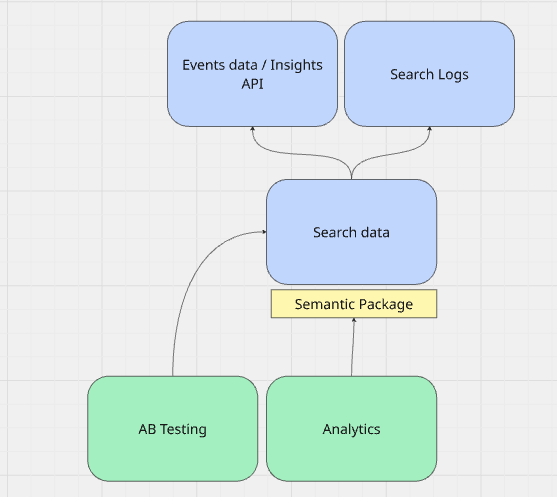
At a high level, customers send us clicks and conversions through an Events API. We combine that with search engine logs, and together we treat that as our search data. We realized we could put a semantic package in front of that search data and have the analytics API read through the semantic layer.
The key shift was moving from “this endpoint returns that metric” to something more like “this endpoint accepts parameters that describe what you want.” In other words, instead of adding a new endpoint every time we introduced a new metric, we wanted to turn endpoints into a more composable interface.
Breaking queries into reusable pieces
Once you commit to a semantic layer, the next step is to standardize how you represent a query. We broke queries down into components that will feel familiar if you’ve worked with SQL: a source (like searches), selected columns, transformations (math on top), and aggregations.
The reason that matters is that many analytics metrics are closely related. Click-through rate and conversion rate are a simple example: structurally they’re very similar, so they map to each other cleanly when you define them as compositions of shared primitives.
This is also where we got the big win on metrics like click-through rate and no-click rate. Instead of calculating them on parallel tracks, we could reuse the logic for pulling clicks and click analytics from search data, reuse tracked searches, and compose the metric calculation more efficiently.


Before, we had strict separation that forced duplication. After, we had reusable components that we could recombine.
An extra step: aligning endpoints with UI components
After we transformed metric retrieval into a parameterized interface, we realized we could take it one step further by thinking about the dashboard itself.
The analytics page isn’t a single metric at a time. A time series visualization might need daily click-through rate plus an overall click-through rate over the full period. A table needs a different aggregation and grouping shape. In practice, UI components are composed of multiple metrics and aggregations.
So we started treating UI components as the unit of service. Instead of having endpoints for individual metrics, we built endpoints that return the data shape needed for a time series or a table. That let us generate all the metrics required for that visualization in one go, and it made the system much faster to extend.
What changed after implementation

Solution: A semantic package for analytics
We migrated our analytics product to the semantic package, and then we made it available to feature teams.
That second part mattered a lot. This wasn’t just a refactor; it was a shift in ownership. Instead of our team being the only code owners for analytics logic, we moved to a shared ownership model where feature teams can contribute and build their own analytics on top of the platform.
That increased velocity significantly. In the old world, it could take up to six weeks to deliver a new set of metrics for a feature launch. In the new world, we’re usually talking about one or two PRs per feature and roughly five days of work for one engineer.
The outcome is what we were aiming for from the beginning: analytics becomes a platform that can serve internal teams and external customers more efficiently, and product teams can take real ownership over their metrics.
The future vision
There are a few directions we’re excited about from here.
- Enabling customers to create custom metrics and graphs more easily. The idea would be that you could request very specific metrics, call the endpoints that correspond to those parameters, and unlock a much wider variety of visualizations. We’ve explored some experimental concepts in that direction already.
- Combining this semantic layer with Algolia’s MCP capabilities. MCP is a model context protocol that allows LLMs to access and operate APIs. If you pair that with a semantic, flexible way of writing analytics queries, you can imagine a path toward more advanced generative analytics — where you describe the graphs and metrics you want, and the system composes them.
What we learned
If I had to distill the project into a couple of lessons, the first is that it’s worth revisiting what should be a parameter versus a fixed endpoint when you’re designing APIs for data products. The conventional “one endpoint, one outcome” model isn’t always the right fit.
The second is that “platformization” and shared ownership can be an incredible accelerator — but timing matters. If you do it too early, you might not get the benefits. Once the old model starts to hurt and you can feel the scaling constraints, it’s probably the right time to invest.
Get involved
If you have feedback on Algolia analytics — what’s helpful today, what you wish you could measure, where you still feel blind — we want to hear it. Explore the analytics page in your Algolia dashboard, and share what you’d like to see next.
Because if you step back, the information customers get from analytics is tremendous. Search behavior tells you what users are looking for, and engagement tells you how well you’re serving them. That loop can reveal a lot about your product, your use case, and even your business — and it’s a powerful foundation for improving relevance over time.
Watch the original presentation below:


.jpg)


%20(2).svg)