For many software engineers, conversations about data storage costs and spend reduction can be daunting. It can feel like your priorities are different to those of your colleagues – SREs or Finance and Product.
FinOps (Development Operations + Financial Operations = FinOps) is a strategic framework you can use to quantify your cloud spend. It’s a common practice that allows everyone at your enterprise to see data costs in the same light.
Explore how unit costs change across different infrastructure scenarios with our interactive demo)
Understanding cloud spend
Let’s start off with some common questions that you'll hear in any company that heavily relies on cloud spend.
What’s the cost of the cloud? How can we reduce total spend? When will we hit the target amount for X (a specific product or service etc). This last one is the hardest to answer – it’s about forecasting unit economics and we’ll get back to it.

(i) FinOps Domains & Capabilities defined by FinOps.org with "Forecasting" and "Unit Economics" capabilities highlighted under the "Quantify Business Value" domain.
Imagine in your SaaS company that your customers upload their data to your servers and you use it to serve traffic to their end users. These servers belong to [kubernetes] clusters, and those clusters are geographically distributed across multiple locations. Servers have replicas from cluster autoscaling and handle multi-tenancy, allowing safe access to data from multiple customers from one cluster.
In order to understand the cost of this service you'll need to capture the total cost per unit. To do this you need two kinds of data:
- Usage data: this is something you probably already have and that the Finance team definitely uses. It tells you how much traffic and data each customer uses every day for every server.
- Cost data: this is something you get from your cloud vendor that tells you in granular detail how much you pay for bandwidth, storage, and virtual machines.
When you combine these two types of data, you can compute the unit cost.
Unit costs = infra costs / traffic units (here, traffic unit is defined as 1M requests).
Let's see how understanding unit costs can help software engineers have a larger impact on the company.
Scenario 1
Imagine that 250 customers join your company over the course of one year. They upload their data to your cluster and it costs around $200k in infrastructure cloud costs to store this data and serve traffic.
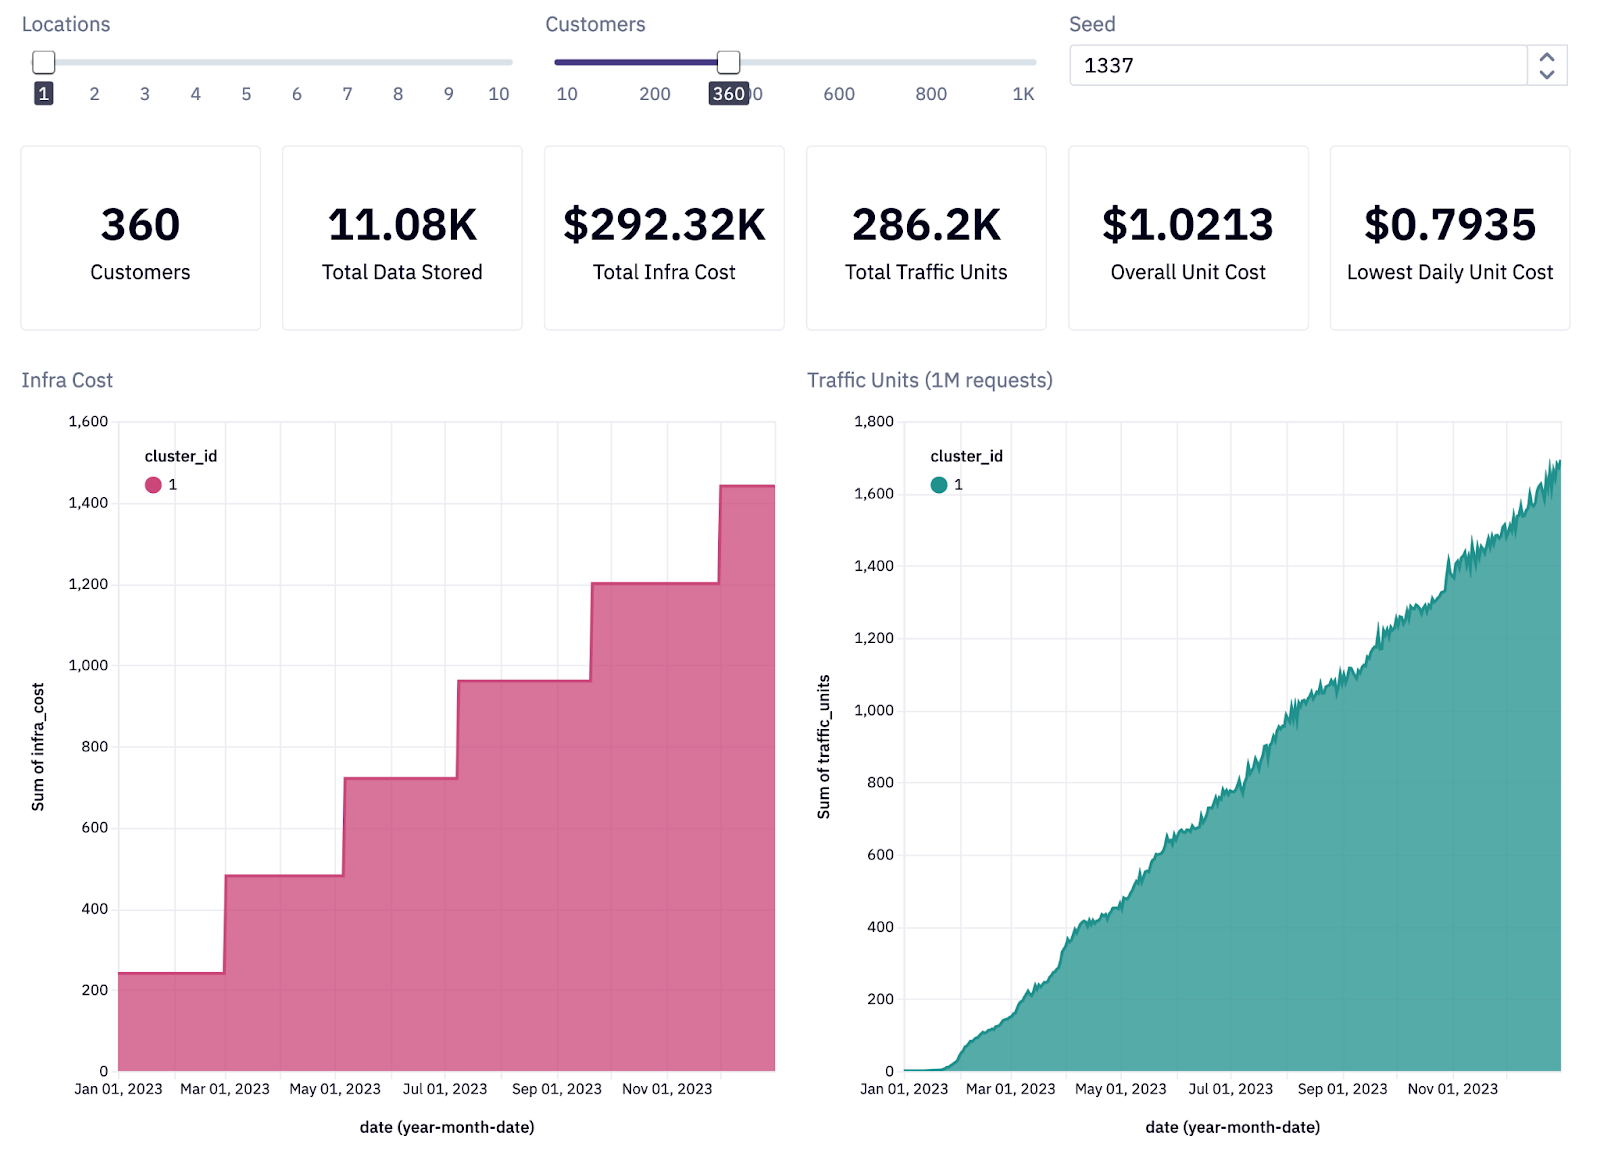
(ii) Simulation settings showing infrastructure costs and traffic over the course of a year.
As the year progresses and more customers upload their data, infrastructure costs increase when we add a new server. This is the staircase graph on the left (the staircase usually goes one way – up!) You’ll need more servers to handle the increase in customer data, and traffic will grow in tandem, although more granularly (ii).
When you divide infrastructure costs by traffic units, you get overall unit costs. These are going to be extremely high in the beginning, due to initial infrastructure overheads, but quickly start to decline. In this scenario you only have one cluster, so your average cluster cost looks the same over time (iii).
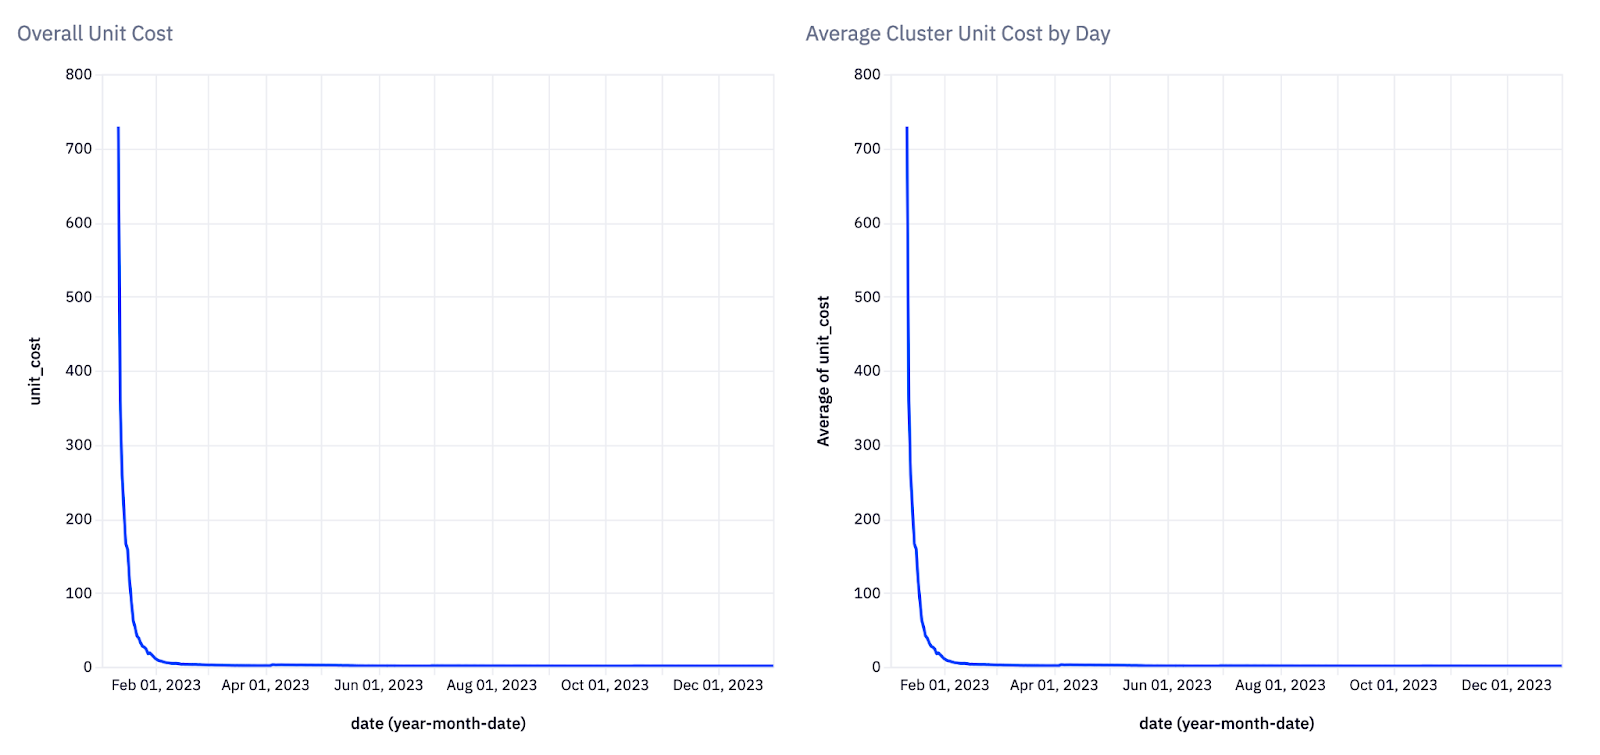 (iii) The behavior of unit costs over time
Scenario 2
What happens when you add 500 more customers joining over the same period of time as in Scenario 1? Of course, you pay more in infrastructure costs, because you have more customers spread across more clusters. Traffic looks the same for the first cluster, while the second cluster is still growing (iv).
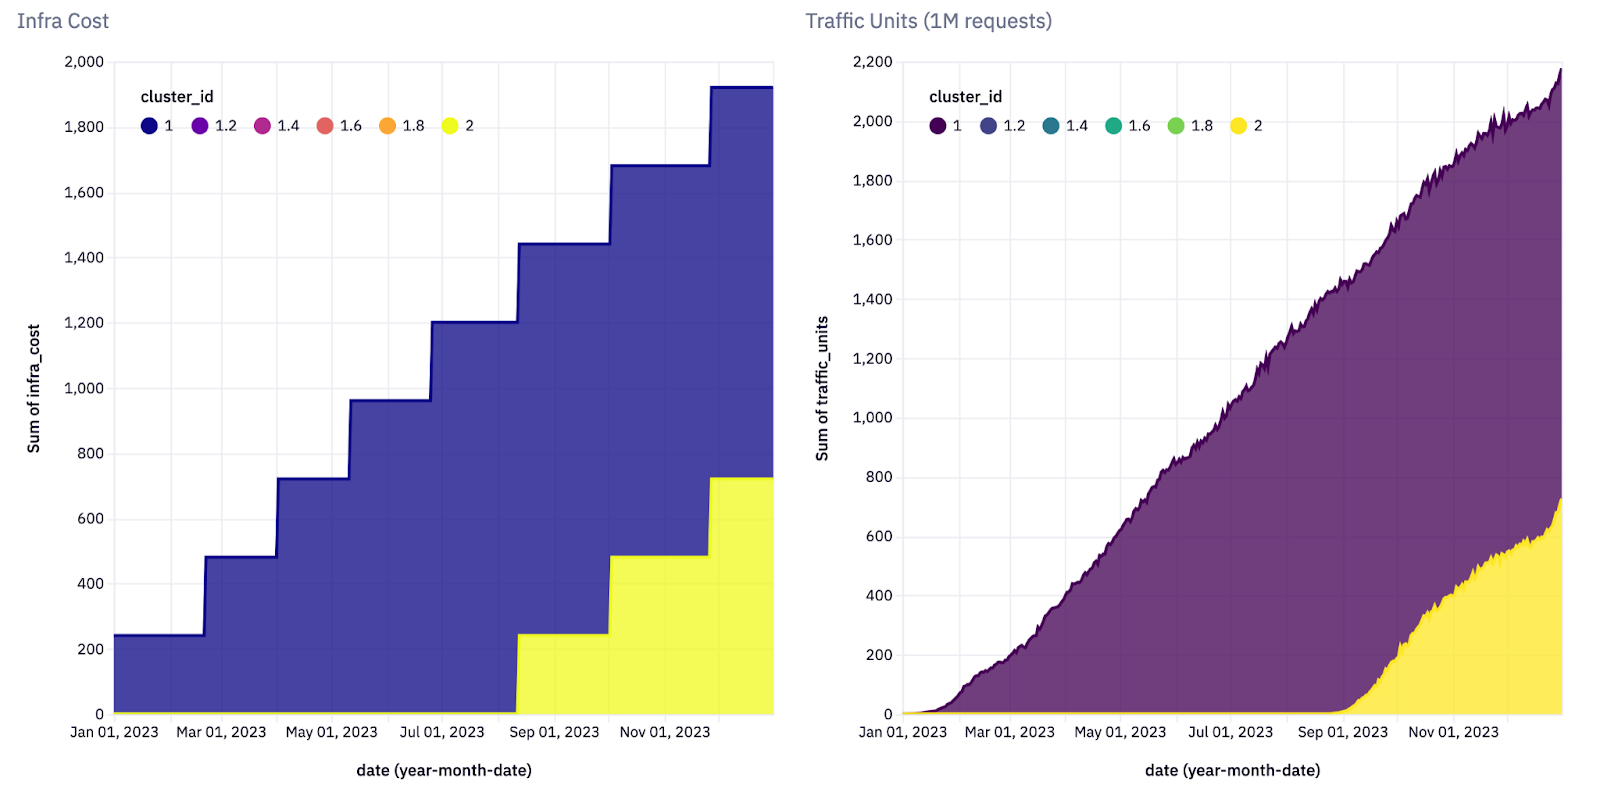 (iv) The growth of both infrastructure costs and traffic as 500 customers join over the course of a year
When you look at overall unit costs, you’ll see they look similar to Scenario 1 , but now that you have more than one cluster, you can see the average unit cost per cluster. Whenever you add a new cluster there will be a regression.
For example, costs jumped on August 17 and only started to stabilize a few months later (v). When you add expensive new infrastructure, it can take a while before the unit cost data is stable. To that end, make sure you don’t price your SaaS application or rely on artificially high unit costs by looking at the data peak points!
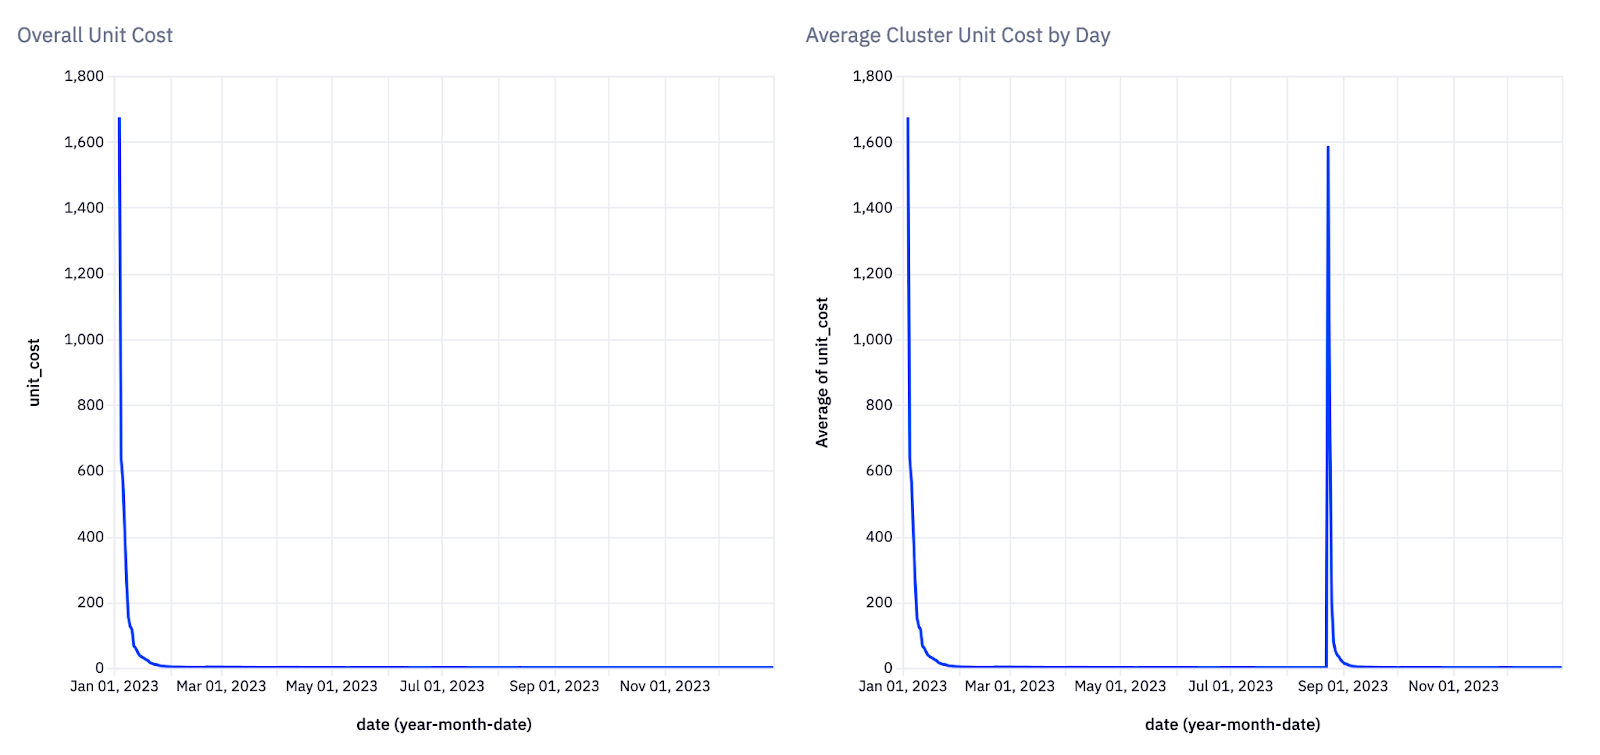 (v) The behavior of unit costs over time
Scenario 3
Now consider a more advanced analysis. You have the same set of data: 500 customers; one location (vi).

(vi) Analyze different scenarios with our interactive demo.
If you view the unit cost data on a logarithmic axis you can start to see some behavior even with low activity. For instance, every time your infra scales up, unit costs jump and take some time to stabilize. This is similar to what you saw when you added a new cluster. But note, the per-cluster overhead is much larger than the per-server overhead. That indicates that you want to saturate your clusters before you create new ones (vii).
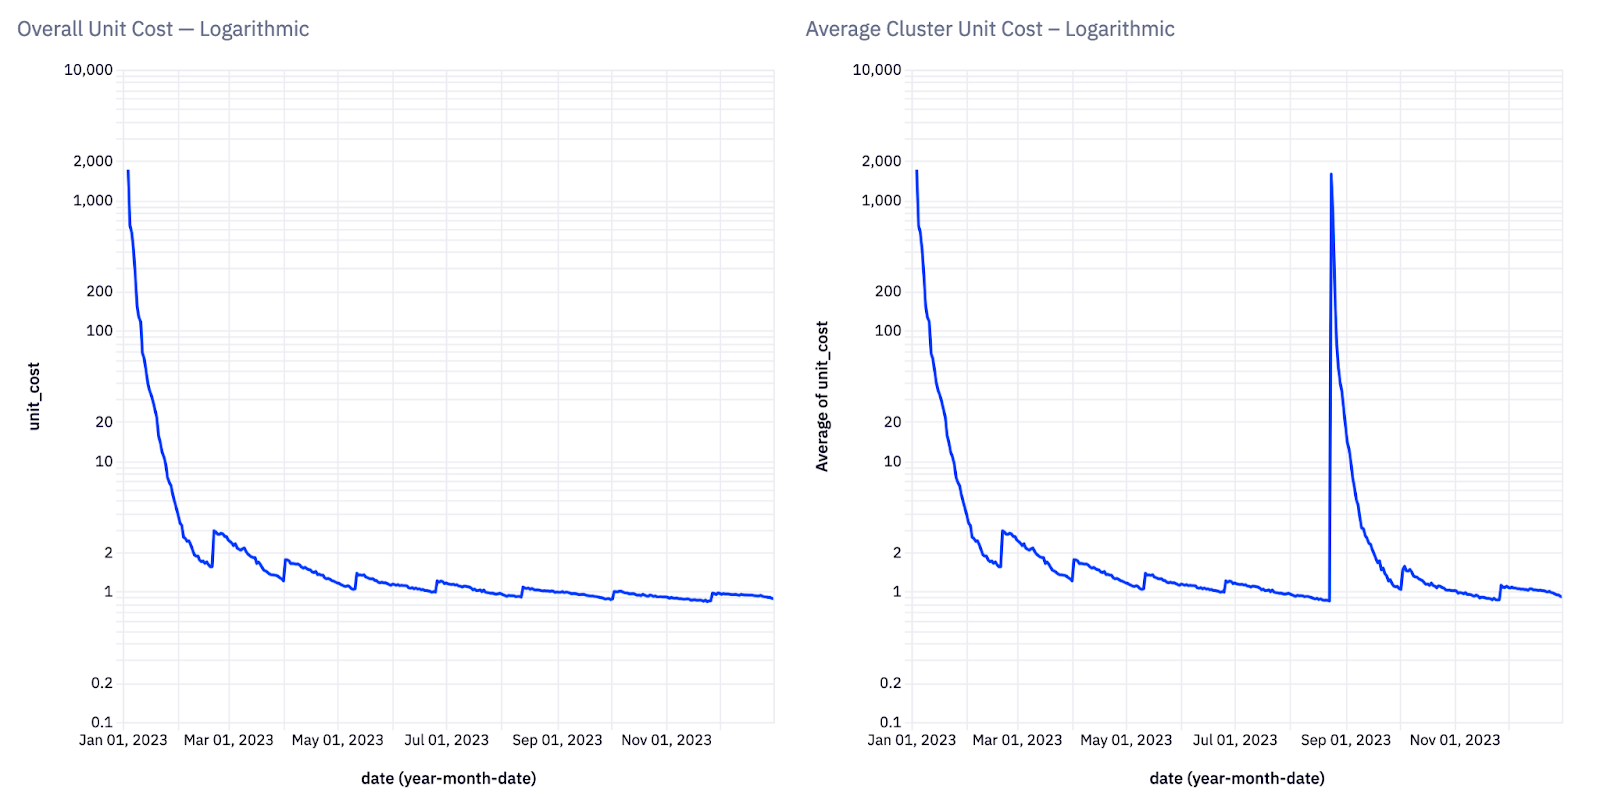
(vii) Unit costs in logarithmic space, allowing us to see small regressions in unit costs as infrastructure costs increase over time
It also means you can improve unit economics by reducing the size of your server (viii).
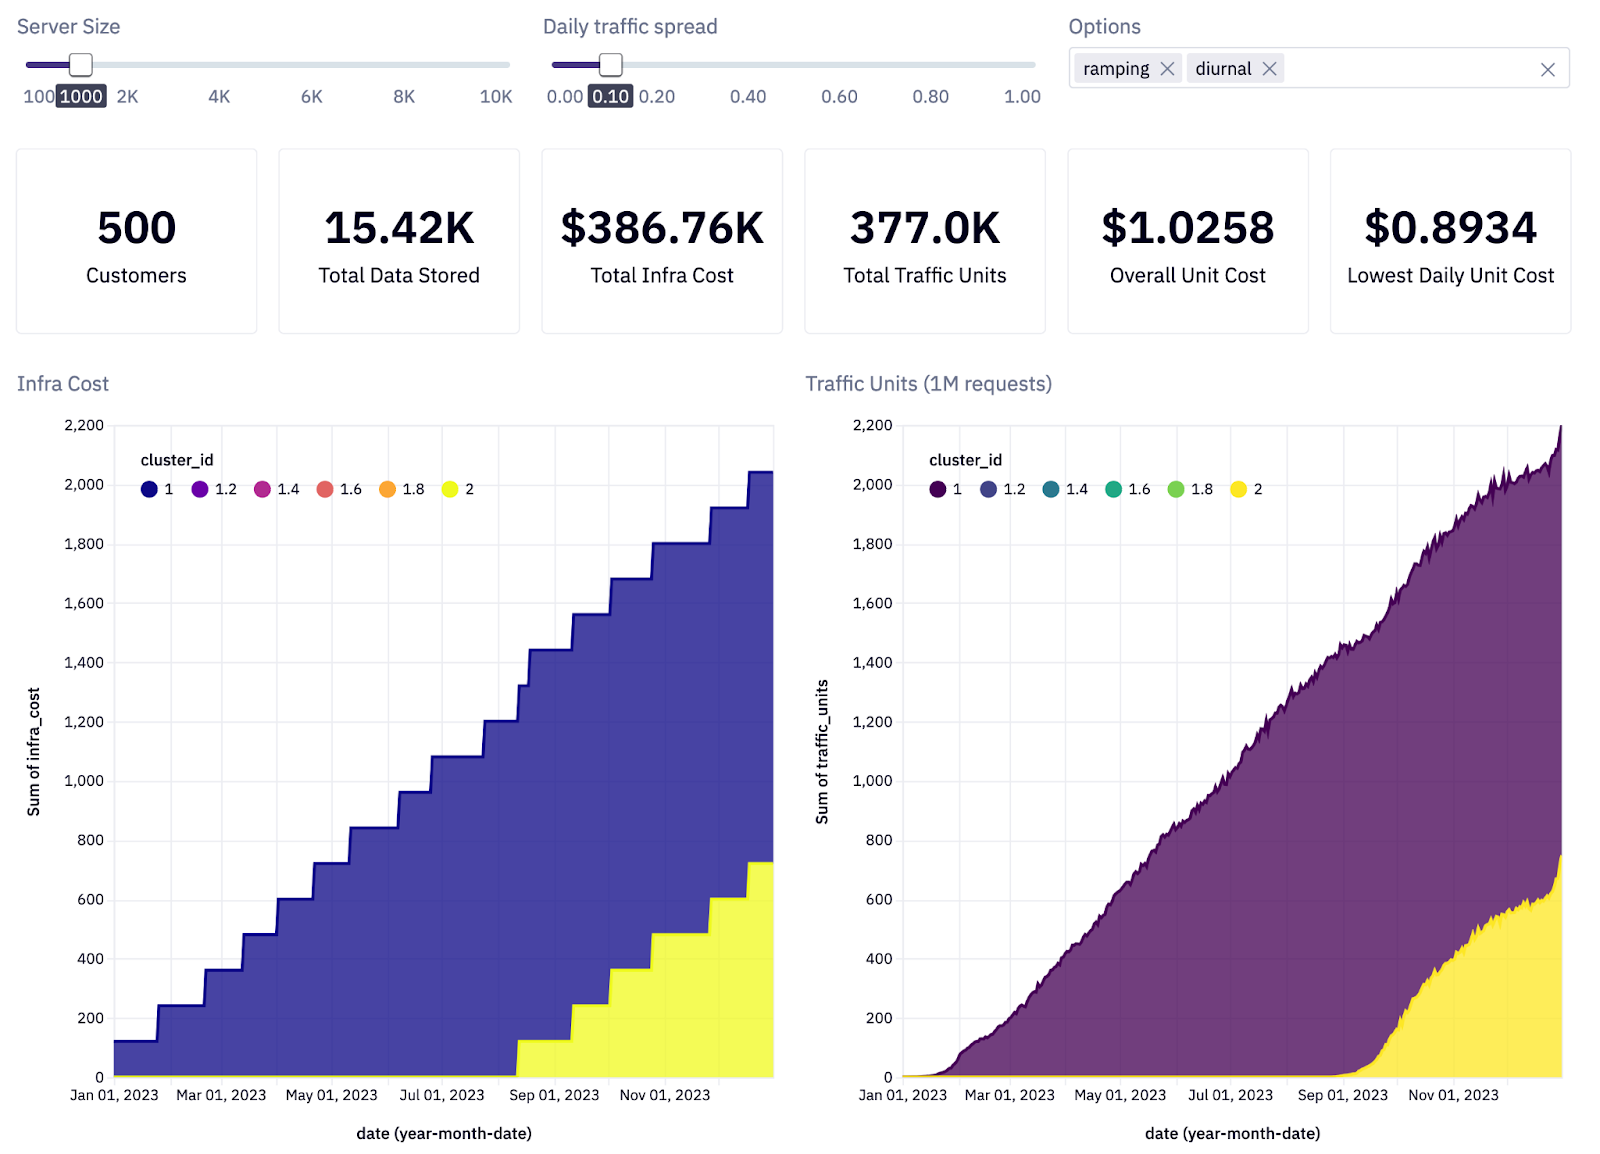 (viii) When smaller virtual machine types are used, infrastructure costs increases are more frequent and smaller, leading to a staircase effect
We reduce the size of the virtual machines in half, and customer data is spread across a larger number of smaller servers. Costs begin to better approximate the traffic and the graphs start to look the same. If you reduce the server size even further, you should see an improvement in our overall unit cost — because you’re fully saturating all our servers.
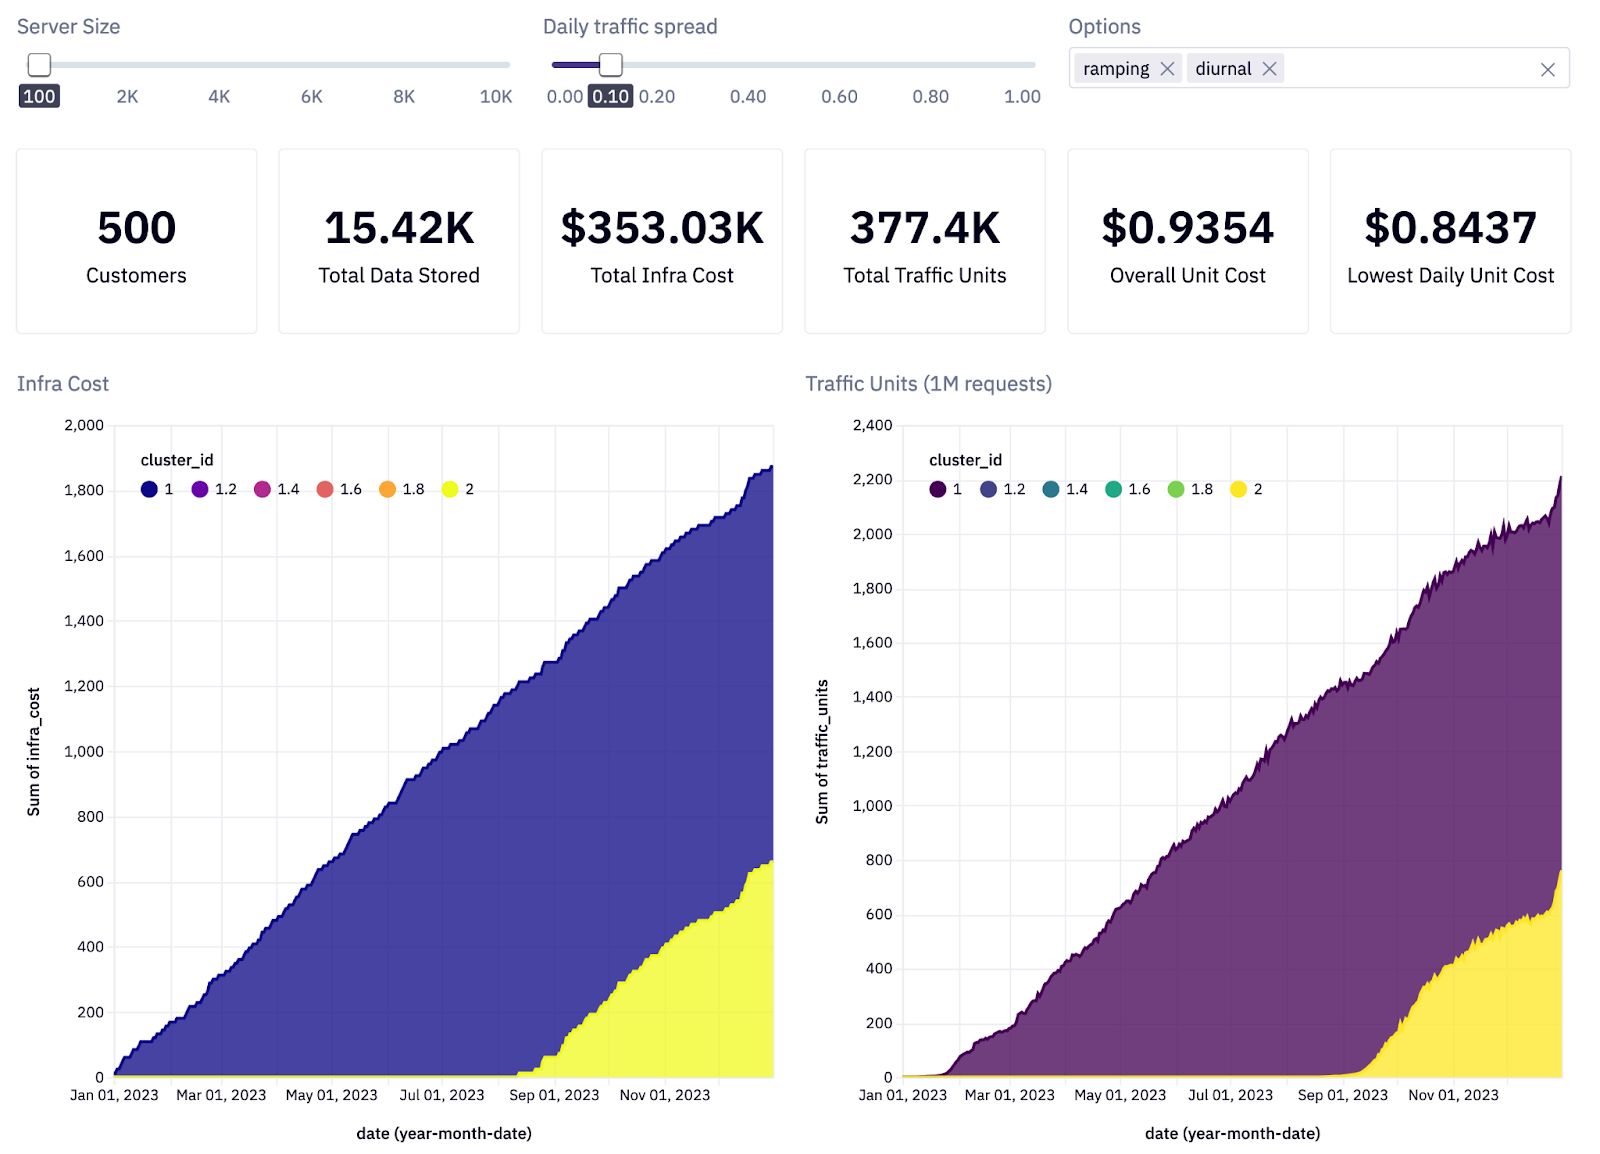
(x) When the smallest virtual machine type is used, infrastructure costs accurately match traffic growth
Our overall unit cost went from $1.02 (see above) to $0.93 (x). The two graphs now look extremely similar, indicating that what we're paying for perfectly matches what we need to serve our customers' traffic, and we have rightsized our infrastructure and optimized our infrastructure costs.
Cost savings vs unit economics
Imagine now that your servers are gargantuan and your clusters can handle a lot of data. How will this affect your unit costs? Will they keep improving? Will they stabilize?
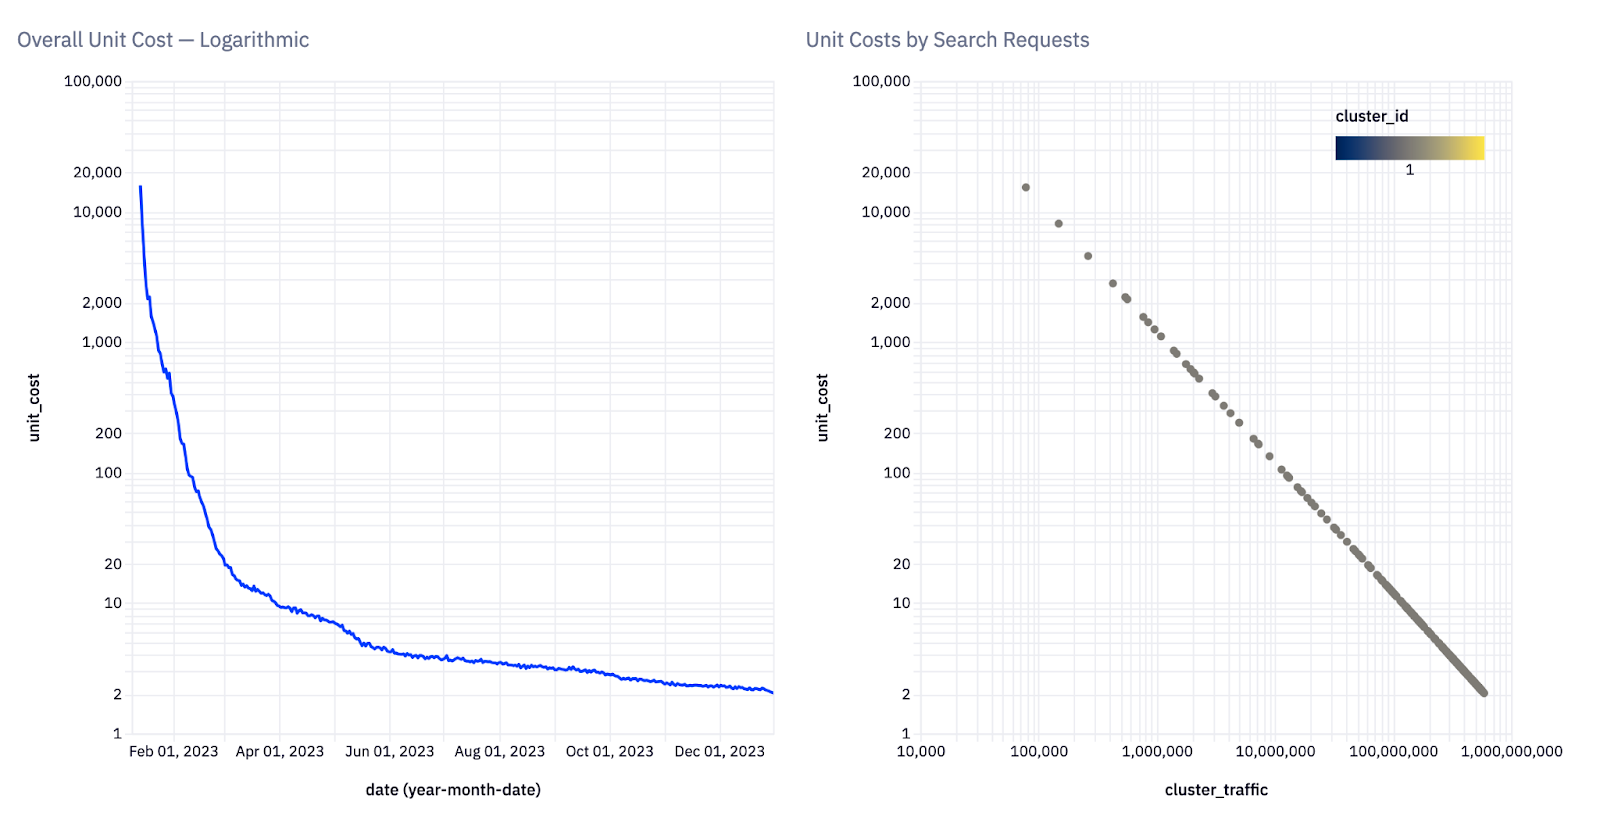
(xi) Linear relationship between unit costs and cluster traffic in logarithmic space
On the left chart below you have unit costs over time. On the right we are viewing unit costs vs traffic in log-log space. The points all line up, indicating that unit cost and cluster traffic are highly correlated. You can imagine skewering all of these points with a line; this is called a linear regression. That line will tell you — assuming the reduction in unit costs continues — what traffic will be necessary to hit some target unit cost. That target unit cost could be when your product becomes profitable or when your margins hit some threshold.
As you saw at the start, overall costs were easy enough to chart, but forecasting when you’d hit a target was more difficult. Viewing unit costs over units in log-log space allows you to do this kind of forecasting visually (xi).
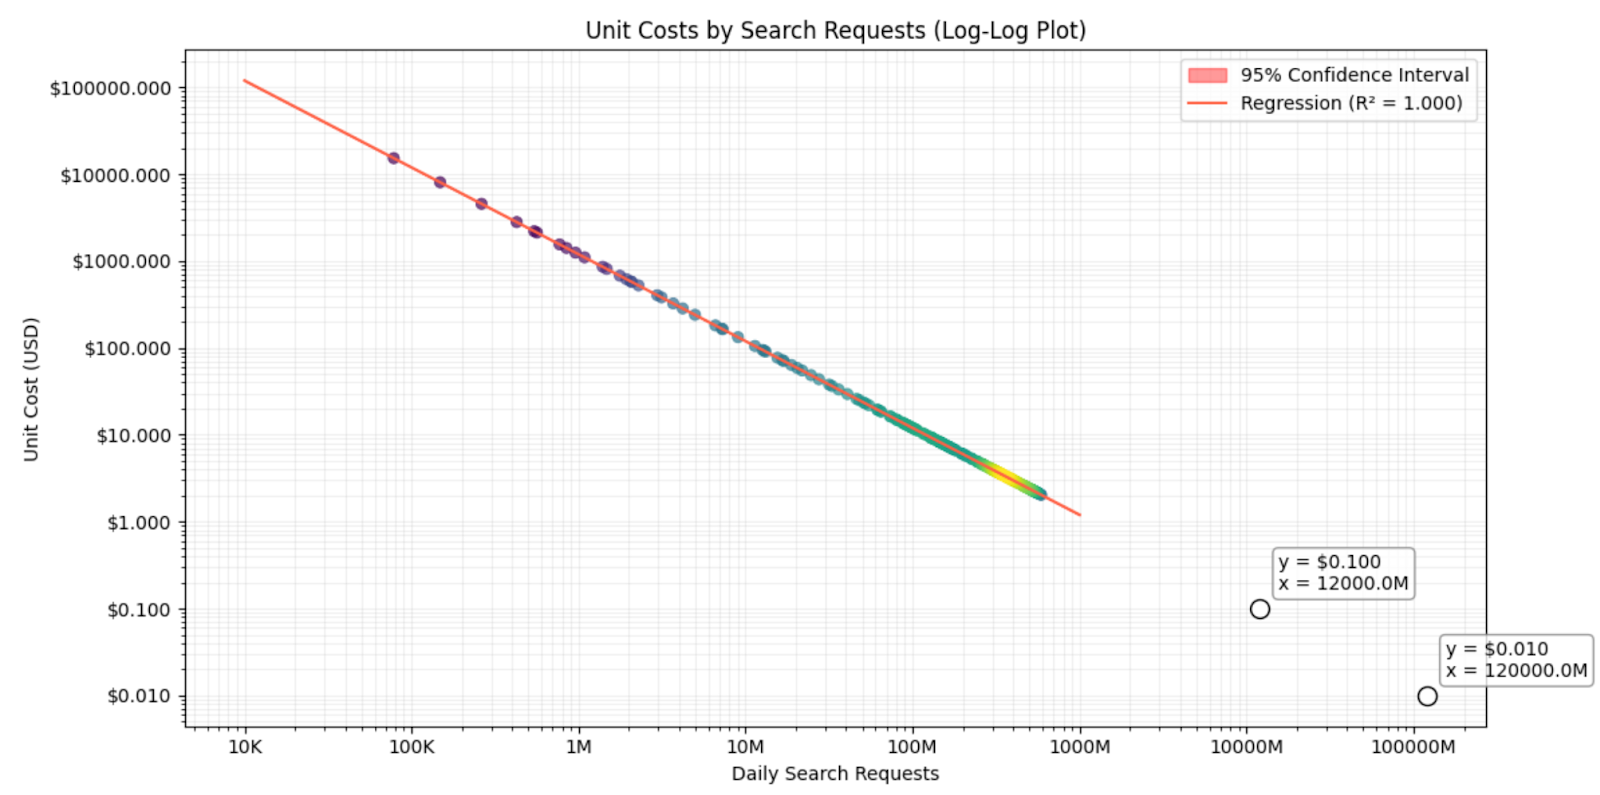
(xii) Linear regression across Unit Cost and Search Traffic in logarithmic space. Two points show estimated unit costs of $0.10 at 12B requests and $0.01 at 120B requests.
Unit economics for all
From these graphs you can see that if you want to hit $0.10 / unit you’ll have to serve 12 billion units (xii). This means you’re not just considering overall savings, but the economics of each unit. Put another way: saving money is not the only way to improve the health of your business; what you really want is improved unit economics.
You might need to spend more money in order to hit an ideal saturation level, but that means your business will be better overall. Cutting the cost of one server to affect overall spend isn’t going to make much of a difference, but a 10% reduction in unit cost is always welcome.
This is something that any Product team — or Finance, or SREs, or management — will understand. This is the shared language of FinOps. Unit cost speaks volumes above more engineering terms like virtual machine reservations or Kubernetes autoscaling. That vernacular works well amongst software engineering teams, but when it comes to being understood and sharing cost analysis as a team, establishing shared nomenclature is extremely effective.
To learn more, watch my DevCon video, FinOps is for Software Engineers.
Starten Sie kostenlos
Die weltweit fortschrittlichste KI-SucheAI Browse
Von KI erstellte Kategorie- und SammlungsseitenAI Recommendations
Vorschläge überall auf der User JourneyMerchandising Studio
Datengestützte Kundenerlebnisse, ohne CodeAnalytics
Alle Ihre Erkenntnisse in einem DashboardUI Components
Pre-built components for custom journeys


