TLDR;
While investigating a performance problem for our cloud-based search engine, we identified an IO performance overhead when the Azure Encryption at Host feature was enabled on a VM. We reproduced the issue with fio, reported it to Microsoft, and worked closely with their Engineering team to address the issue. This collaboration was successful, with the Microsoft Engineering team discovering that enabling Encryption at Host on VMs already utilizing hardware-level encryption led to dramatic performance degradation due to a unintended double encryption. Curious? Let’s dig deeper into the heart of the issue!
Context
Algolia is a high-performance, scalable search-as-a-service platform built on a proprietary engine that stores indices as binary files, each potentially reaching several gigabytes in size to support low-latency, real-time search.
Our next-generation search engine is built to run on Kubernetes and deploy seamlessly across major cloud providers. But as we scaled in production, we hit a curious snag: on Azure, Searcher pods were showing unexpectedly high disk load times when loading indices,averaging 400ms and peaking into the seconds at P99. This was a stark contrast to our AWS and bare-metal environments, where anything over 10ms would be considered abnormal and immediately flagged as “slow load” by our monitoring system.
This discrepancy wasn’t just a metrics anomaly, it had real performance consequences. In our engine, each time an index is updated, the corresponding data must be reloaded from disk into memory to reflect the latest changes. This reload affects all the search queries hitting the new index, which are forced to wait for the disk I/O to complete. For customers with high-frequency indexing, up to 4 updates per second, this introduces repeated delays of around 400ms per reload. These delays not only increase overall query latency but also lead to underutilized CPU resources, as processing cores remain idle while waiting for disk operations to finish.
At first, we mitigated the issue by scaling aggressively, provisioning dozens of VMs to maintain performance and ensure our customer experienced no degradation in service. But we knew this was only a temporary and costly fix. It was clear we needed a sustainable solution, which led us to launch a full-scale investigation to uncover the root cause and not only fix the symptoms.
The investigation - “never assume, always check”
First things, first, let’s check the hardware we’re using in case we’d have missed something obvious in the machines specifications.
VM specifications
- Azure:
Standard_E16d_v5 with a single Ephemeral local SATA SSD
- AWS:
r6i.4xlarge with EBS gp3, configured to match the IOPS and throughput of Azure's SSD.
At first glance, both setups seemed equivalent. But they differ in architecture:
Azure's ephemeral disk is local to the VM, fast but tied to the host.
Ephemeral OS disks are ideal for stateless workloads [...] With Ephemeral OS disk, you get lower read/write latency to the OS disk...” Azure Docs
AWS EBS gp3 is a remote SAN-backed volume but known to give good performance.
The machines specs are roughly the same so the problem lies elsewhere, let’s check another parameter at play, the encryption.
Encryption
We encrypt all data at rest, using the providers' native solutions:
Could the encryption mechanism or the disk type be the source of the performance difference?
Testing & reproduction
Standard fio benchmark
We began by benchmarking both environments using fio for sequential and random reads and writes, following the providers’ recommendation for benchmark. The results aligned perfectly with the VM specs, meaning no performance anomalies, no red flags. However, these synthetic tests didn’t reflect the latency issues we were observing in production. That’s when we decided to build a “real-world” reproduction closer to our actual workload behavior.
Real world reproduction
We recreated a minimal yet realistic load scenario using our performance testing framework (based on k6s):
- Workload 1: Multiple Builders indexing constantly for a single Searcher.
- Workload 2: Searcher handling queries, triggering index loads.
This setup generated the expected I/O pressure on the searcher. And sure enough: on Azure, we reproduced the high load times, but not on AWS.
Now we had a reproducible case to continue the investigation! One of our first intuition was that the encryption could create an overhead, that’s why we started by disabling the encryption.
Disabling Encryption
To isolate the impact of encryption, we disabled it on Azure and re-ran our workload. Results:
- With encryption: ~300 slow loads (200–300ms range)
- Without encryption: ~100 slow loads (20–30ms range)
Disabling encryption gave us a clear performance improvement and a strong evidence that encryption was playing a role in the slowdown. Of course, turning off encryption is fine for reproducing the issue, but definitely not a viable solution in production. Still, it gave us a solid lead to dig deeper into what was really going on.
“bypass kcryptd workqueues” Linux Kernel Optimization
Inspired by Cloudflare’s blog on Linux disk encryption performance, we tried the cryptsetup flags to bypass kcryptd workqueues, a queue in the Linux kernel that handles encryption and decryption tasks. These workqueues can introduce overhead under certain I/O patterns, so bypassing them seemed worth testing in our scenario.
sudo cryptsetup --perf-no_read_workqueue --perf-no_write_workqueue --persistent open <device>
But Azure’s native host encryption hides the devices, making this configuration impossible. To test the optimization, we launched a node with an unencrypted disk and applied manual encryption via cryptsetup using an init script.
The results were eye-opening:
- Zero slow loads during the test
- IOAwait dropped to 450µs, down from 18ms
This showed that bypassing the kernel workqueues dramatically reduces encryption-induced I/O latency and that something was “wrong” with how encryption was handled in.
Getting in touch with Microsoft
To move the investigation forward with Microsoft, we needed a reliable and portable reproduction of the disk I/O issue. Our internal performance framework had already highlighted the problem, but provider support teams typically need a self-contained test case they can run on their side.
So, we built a fio-based workload that mimics the behavior of our Searcher pods. This setup simulates concurrent read and write operations to stress I/O under conditions similar to what we observe in production.
Building the realistic fio Reproduction
Each of our Searcher pod has two containers sharing a disk:
- Driver: Downloads updated indices and triggers reloads
- Searcher: Serves queries and
mmaps index files on first access
To mimic this with fio we need one fio command that writes (simulating the Driver) and another fio command that reads (simulating the Searcher).
Key Parameters for the Reproduction
To build the reproduction we needed to adjust multiple knobs to be as close as possible to the real world use-case.
I/O engine
- Reads use
mmap, matching how our Searcher loads indices.
- Writes use
psync, reflecting how the Driver container handles downloads
Data size
- The Searcher reads ~50GB of data.
- The Driver writes ~2GB chunks (matching the size of typical index files).
Block size
- We use 4MB blocks for writes, aligning with the Azure Blob Storage Go SDK default.
Here’s the fio command used to simulate this load:
# Driver/Writer
fio --name=download --directory=$PWD --size=2G --numjobs=30 --time_based --runtime=70s --ramp_time=2s --ioengine=psync --verify=0 --bs=4M --rw=write --group_reporting=1 --eta=never &
sleep 2;
# Searcher/Reader
fio --name=mmap_read --filename=fio_blob --directory=$PWD --size=50G --numjobs=8 --time_based --runtime=60s --ramp_time=2s --ioengine=mmap --verify=0 --bsrange=4K-1M --rw=randread --group_reporting=1 --eta=never &
sleep 5;
iostat -mx -t 10 5
Testing the reproduction before sending it to Microsoft
We ran this test on Azure EDV5 instances in three configurations:
Encryption at host enabled
This configuration showed significant latency and very low throughput, confirming what we observed in our production workloads.
Read: IOPS = 4, BW = 2.6 MB/s Avg. Latency = 1.6s, P99 = 6.3s, P99.9 = 7.1s
Encryption at host disabled
Disabling Azure's host-level encryption improved performance considerably, IOPS tripled and latency dropped by a factor of 2.5.
Read: IOPS = 12, BW = 6.3 MB/s Avg. Latency = 643ms, P99 = 1.9s, P99.9 = 2.1s
Encryption disabled + kcryptd optimization (bypassing kernel workqueues)
best performance by far, over 8x the IOPS of the default setup and a 7x reduction in average latency. Most importantly, it validates the findings from Cloudflare’s kernel tuning post: bypassing the kernel’s kcryptd workqueues can drastically reduce encryption-induced latency.
Read: IOPS = 33, BW = 16.8 MB/s Avg. Latency = 238ms, P99 = 2.2s, P99.9 = 4.3s
Ok, now we’re good to send the case to Microsoft as we were able to prove that the way encryption is handled at the Kernel / Hypervisor level might not be optimal for our use-case.
Collaboration with Microsoft
We opened our support ticket to engage the discussion with Microsoft:
We quickly got on a call with the Microsoft team to reproduce the issue live. One of their engineers spun up multiple VMs with various configurations to match our scenario, and they were able to reproduce the problem on their end. Following the call, the issue was escalated to Microsoft’s Storage and Compute product group for deeper investigation.
Conclusion
After exchanging a bunch of information via email and a few weeks later we got this e-mail!
Hello Algolia Team,
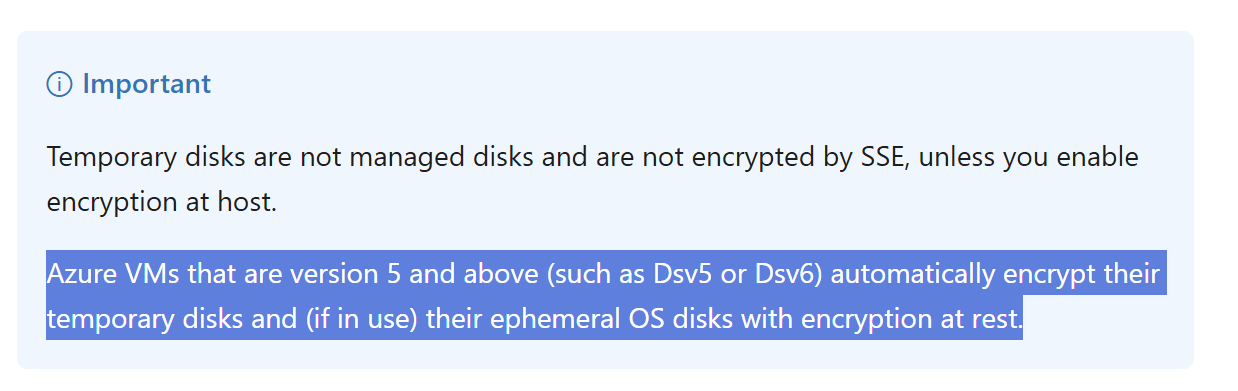
We have some important information regarding the Ephemeral disk encryption performance issue to share with you coming from our Microsoft engineering team.
It turned out that Azure VMs version 5 and above automatically encrypt at the hardware level their temporary/ephemeral disks. However, when Encryption at Host was also enabled on these VMs, it resulted in double encryption, a setup that significantly degraded performance for our workload. At the time, prior to April 2025, this behavior was undocumented and largely unknown. But following our investigation, collaboration and our findings with Microsoft engineers, Azure's documentation has since been updated to reflect the implications of double encryption and guide users on how to avoid it. Once the fix was deployed across our infrastructure, we decommissioned the surplus nodes and finally returned to being CPU-bound rather than IO-bound, restoring our baseline performance.
"Never assume, always check" is our takeaway because this experience was a deep dive into root cause analysis. It’s a reminder that sometimes performance bottlenecks are had to diagnose, but with careful debugging, good data, and collaboration with providers, even cloud-level issues can be resolved. Kudos to the Azure engineering team for working with us to identify and fix the issue.
 Starten Sie kostenlos
Die weltweit fortschrittlichste KI-Suche
Starten Sie kostenlos
Die weltweit fortschrittlichste KI-Suche AI Browse
Von KI erstellte Kategorie- und Sammlungsseiten
AI Browse
Von KI erstellte Kategorie- und Sammlungsseiten AI Recommendations
Vorschläge überall auf der User Journey
AI Recommendations
Vorschläge überall auf der User Journey Merchandising Studio
Datengestützte Kundenerlebnisse, ohne Code
Merchandising Studio
Datengestützte Kundenerlebnisse, ohne Code Merchandising Studio
Datengestützte Kundenerlebnisse, ohne Code
Merchandising Studio
Datengestützte Kundenerlebnisse, ohne Code Analytics
Alle Ihre Erkenntnisse in einem Dashboard
Analytics
Alle Ihre Erkenntnisse in einem Dashboard UI Components
Pre-built components for custom journeys
UI Components
Pre-built components for custom journeys


%20(2).svg)
