This page outlines those metrics and the different tabs of the Analytics dashboard.
The metrics in the Overview tab and others come in two categories: out of the box metrics and click and conversion metrics. Click and conversion metrics only appear if your plan includes Event Analytics and if you’ve implemented event tracking.
NOTE
All metrics on all tabs are index specific. If you’re seeing unexpected metrics, make sure you’ve selected the correct index and date range. You can choose to include all replicas to aggregate replica index analytics.
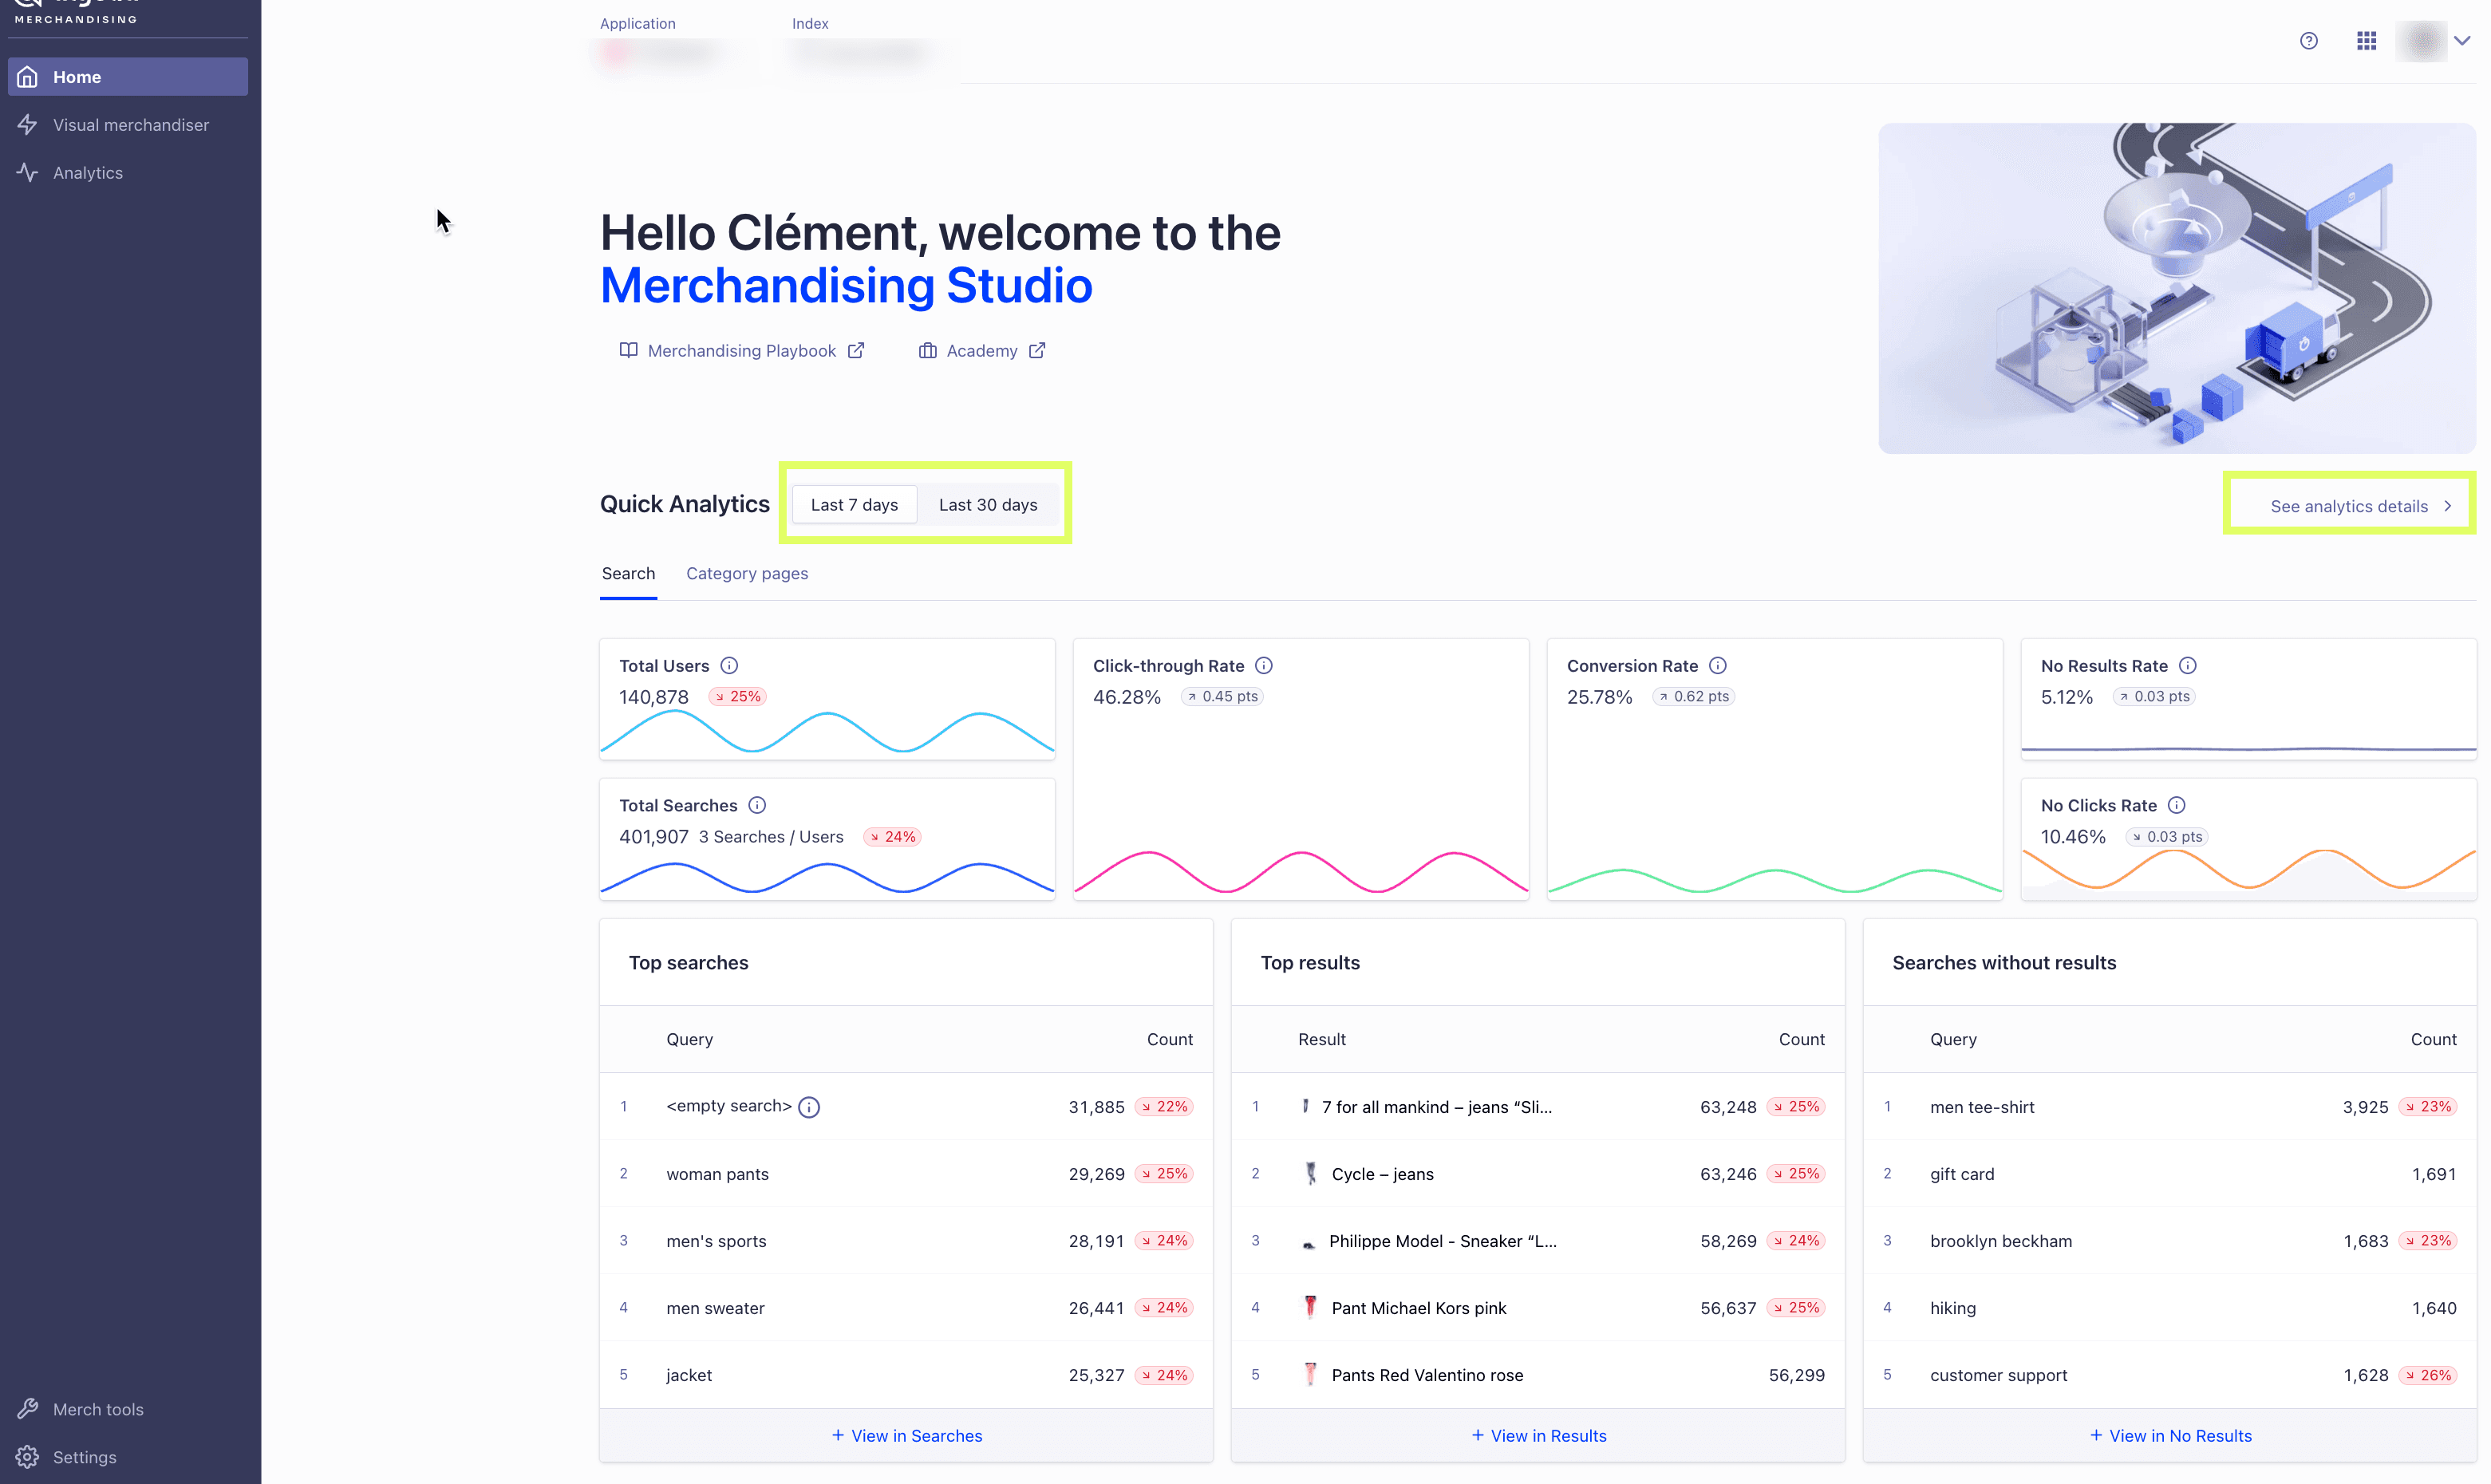
Algolia’s new Merchandising Studio features Quick Analytics, allowing you to view your Search and Category Page KPIs at a glance as soon as you log into the tool. On the homepage, you’re able to choose to see data from a Last 7 days or a Last 30 days timeframe.
Need a closer look? Click See analytics to select a custom date range, filter by analytics tags, and compare performance for different date ranges of your choice. Our Trends Overview provides you with a visual view of how your KPIs performed for the date range you’ve chosen. Click Position shows you the average position of the product engagement from the search results.
1. Load the dashboard section “Analytics”
2. Select the correct index
3. In the top navigation menu select “Overview” tab
4. Review the following analytics summary data:
Load the dashboard section “Analytics”
Select the correct index
In the top navigation menu select “Searches” tab
This tab shows:
In the “Query” column, click on a search term to see:
1. Load the dashboard section “Analytics”
2. Select the correct index
3. In the top navigation menu select “Searches without Results” tab
4. You can view all the searches your customers made on the website that returned no results. This information can be used to identify synonyms that you may need to configure in order to improve search relevance. Additionally, these queries can serve as an indicator of a trend or customer demand for products or services not currently featured in your online catalog, but might be worse considering to be added to it.
1. Load the dashboard section “Analytics”
2. Select the correct index
3. In the top navigation menu select “Searches without Results” tab
4. In the "Query" column, click on the search term to see
1. Load the dashboard section “Analytics”
2. Select the correct index
3. In the top navigation menu select “Searches without Clicks” tab
4. Review the top results or search for a specific catalog item
5. Optional: Filter the results by attributes
1. Load the dashboard section “Analytics”
2. Select the correct index
3. In the top navigation menu select “Filters” tab
4. Select the date range
5. Optional: Toggle the Analytics tags to get a more granular view. For example, you can get a more granular view for users who did not see the 'promo' by selecting "sawPromo:false"
6. Review the filters tab data:
Top filtering attributes - the attributes users filter on most, for example, “color,” “category,” “brand,” etc.
Popular values per filter - the attributes values users filter with, for example, “red,” “yellow,” “purple” etc. You can select which filtering attribute (for example, “color”) you want to see the values for.
7. You can use this analytics to improve your faceting configuration. For example, if your users filter on "size" and "color" attributes, but not your brand one, then you can remove your brand filter, or display it lower on your page. The same goes for filter values: If colors red and yellow are used more often than purple, you can adjust your inventory by stocking less purple items, or adjust your index settings by favoring or promoting red and yellow over purple.
1. Load the dashboard section “Analytics”
2. Select the correct index
3. In the top navigation menu select “Geo” tab
4. Optional: Toggle the "analytics tags" to get more granular view. For example, you can get a granular view for new users by selecting "customerType:new"
5. Review the "Geo" tab data:
Average search latency
Geographical origin of the searches, and the associated network latency (sorted by country, in descending
order)
Q: What is “empty search”?
A: Search performed without text input:
Q: What is the analytical value of the “empty search” metric?
A: Analyse the relevance of your index, including the ways users interact with an empty search. For example, are products that show up first in the empty search popular or not?
Q: When to exclude the “empty search” metric from the analysis?
A: When an “empty search” lacks analytical value or skews the data. For example, most blogs sort articles by publication date, so empty search metrics give little insight into relevance.
Q: How to exclude the “empty search” metric from the analysis?
A: Refer to the How to Remove the Empty Search from Analytics guide.
Note: you might need to be assisted by the engineering team to perform this task.
Q: How to prevent sending empty queries all together?
A: You can turn off search on empty queries.
Note: you might need to be assisted by the development team to perform this task.